Chart.DefaultElement.ToolTip = "%Name"; // Demonstrates how a box and whisker chart is constructed.
// The important part in this sample is the loop below that creates the elements.
// *DYNAMIC DATA NOTE* // This sample uses random data to populate the chart. To populate // a chart with database data see the following resources: // - Classic samples folder // - Help File > Data Tutorials // - Sample: features/DataEngine.aspx SeriesCollection mySC = getRandomData();
// Add the random data. Chart.SeriesCollection.Add(mySC);
}
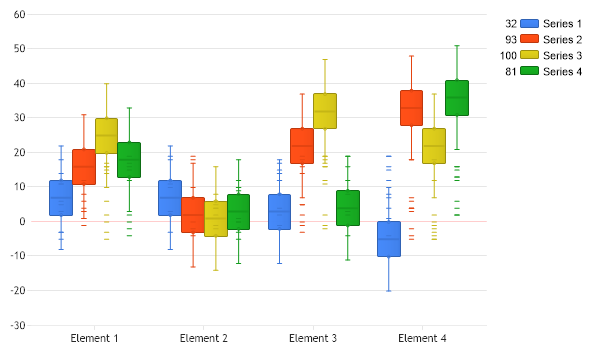
SeriesCollection getRandomData() { SeriesCollection SC = new SeriesCollection(); Random myR = new Random(1); for(int a = 1; a < 5; a++) { Series s = new Series(); s.Name = "Series " + a.ToString(); for(int b = 1; b < 5; b++) { Element e = new Element(); e.Name = "Element " + b.ToString(); // Create a range column. e.YValue = myR.Next(50); e.YValueStart = e.YValue - 10; // Add error bars. e.ErrorOffset = 10; // Create a bar going through the column SubValue sv = SubValue.FromValue(e.YValue-((e.YValue-e.YValueStart)/2)); sv.Line.Width = 2; sv.Line.Length = 21; sv.Type = SubValueType.Line; e.SubValues.Add(sv);
// Add 10 sub values for the smaller induvidual bars. for(int l = 0; l < 10; l ++) { e.SubValues.Add(SubValue.FromValue(myR.Next(25)-5)); e.SubValues[e.SubValues.Count-1].Type = SubValueType.Line; } s.Elements.Add(e); } SC.Add(s); }
Chart.DefaultElement.ToolTip = "%Name" ' Demonstrates how a box and whisker chart is constructed.
' The important part in this sample is the loop below that creates the elements.
' *DYNAMIC DATA NOTE* ' This sample uses random data to populate the chart. To populate ' a chart with database data see the following resources: ' - Classic samples folder ' - Help File > Data Tutorials ' - Sample: features/DataEngine.aspx Dim mySC As SeriesCollection = getRandomData()
' Add the random data. Chart.SeriesCollection.Add(mySC)
End Sub
Function getRandomData() As SeriesCollection Dim SC As SeriesCollection = New SeriesCollection() Dim myR As Random = New Random(1) For a As Integer = 1 To 4 Dim s As Series = New Series() s.Name = "Series " & a.ToString() For b As Integer = 1 To 4 Dim e As Element = New Element() e.Name = "Element " & b.ToString() ' Create a range column. e.YValue = myR.Next(50) e.YValueStart = e.YValue - 10 ' Add error bars. e.ErrorOffset = 10 ' Create a bar going through the column Dim sv As SubValue = SubValue.FromValue(e.YValue-((e.YValue-e.YValueStart)/2)) sv.Line.Width = 2 sv.Line.Length = 21 sv.Type = SubValueType.Line e.SubValues.Add(sv)
' Add 10 sub values for the smaller induvidual bars. For l As Integer = 0 To 9 e.SubValues.Add(SubValue.FromValue(myR.Next(25)-5)) e.SubValues(e.SubValues.Count-1).Type = SubValueType.Line Next l s.Elements.Add(e) Next b SC.Add(s) Next a
Return SC End Function </script> </head> <body> <div style="text-align:center"> <dotnet:Chart id="Chart" runat="server" Width="568px" Height="344px"> </dotnet:Chart> </div> </body> </html>