// *DYNAMIC DATA NOTE* // This sample uses random data to populate the chart. To populate // a chart with database data see the following resources: // - Classic samples folder // - Help File > Data Tutorials // - Sample: features/DataEngine.aspx SeriesCollection mySC = getRandomData();
// First we need to sort the element in descending order by the y value. mySC[0].Sort(ElementValue.YValue,"DESC");
// For this sample to work correctly we need to specify an axis for our series and then pass it to the // getParetoSeries method. mySC[0].YAxis = new Axis();
// Change the column label alignment. mySC[0].DefaultElement.SmartLabel.Alignment = LabelAlignment.Center;
// Add the random data. Chart.SeriesCollection.Add(mySC[0]); Chart.SeriesCollection.Add(getParetoSeries(mySC[0],mySC[0].YAxis));
} SeriesCollection getParetoSeries(Series s,Axis a) { // This method will return 2 series in order to create the pareto chart. Series result = new Series(); Series result2 = new Series();
double sum = s.Calculate("",Calculation.Sum).YValue; double runningSum = 0;
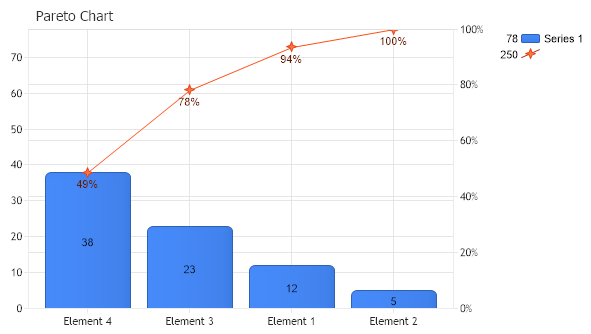
// The first series will be the visible line, it's y values will be the running sum but we will set the labels // to represent the percentages. The reason the series needs the running sum values is because we want it to start // at the top of the first column and so it also needs to be on the same y axis as the original series. // The second series will be there to relate to the percentage labels of the first series to a percent axis so we set those // element values to the percent values.
foreach(Element el in s.Elements) { runningSum += el.YValue; Element curEl = new Element(el.Name,runningSum); curEl.SmartLabel.Text = (runningSum*100/sum).ToString("0") + "%"; result.Elements.Add(curEl); result2.Elements.Add(new Element(el.Name,runningSum*100/sum));
}
result.Type = SeriesType.Line; // The visible series needs to be on the specified axis. result.YAxis = a;
// Add the percentage axis. result2.YAxis = new Axis(); result2.YAxis.Percent = true; result2.YAxis.Orientation = dotnetCHARTING.Orientation.Right;
// In order for the two axes to match the first series y axis will need to end at the running sum of the values. result.YAxis.Maximum = sum;
// We dont really want to show the series on the chart so we will set the element colors to empty and get rid of the // legend entry. result2.Type = SeriesType.Marker; result2.DefaultElement.Color = Color.Empty; result2.LegendEntry.Visible = false;
// Add the series to a collection and return it. SeriesCollection sc = new SeriesCollection(); sc.Add(result); sc.Add(result2);
return sc; }
SeriesCollection getRandomData() { SeriesCollection SC = new SeriesCollection(); Random myR = new Random(1); for(int a = 1; a < 2; a++) { Series s = new Series(); s.Name = "Series " + a; for(int b = 1; b < 5; b++) { Element e = new Element(); e.Name = "Element " + b; //e.YValue = -25 + myR.Next(50); e.YValue = myR.Next(50); s.Elements.Add(e); } SC.Add(s); }
' *DYNAMIC DATA NOTE* ' This sample uses random data to populate the chart. To populate ' a chart with database data see the following resources: ' - Classic samples folder ' - Help File > Data Tutorials ' - Sample: features/DataEngine.aspx Dim mySC As SeriesCollection = getRandomData()
' First we need to sort the element in descending order by the y value. mySC(0).Sort(ElementValue.YValue,"DESC")
' For this sample to work correctly we need to specify an axis for our series and then pass it to the ' getParetoSeries method. mySC(0).YAxis = New Axis()
' Change the column label alignment. mySC(0).DefaultElement.SmartLabel.Alignment = LabelAlignment.Center
' Add the random data. Chart.SeriesCollection.Add(mySC(0)) Chart.SeriesCollection.Add(getParetoSeries(mySC(0),mySC(0).YAxis))
End Sub Function getParetoSeries(ByVal s As Series, ByVal a As Axis) As SeriesCollection ' This method will return 2 series in order to create the pareto chart. Dim result As Series = New Series() Dim result2 As Series = New Series()
Dim sum As Double = s.Calculate("",Calculation.Sum).YValue Dim runningSum As Double = 0
' The first series will be the visible line, it's y values will be the running sum but we will set the labels ' to represent the percentages. The reason the series needs the running sum values is because we want it to start ' at the top of the first column and so it also needs to be on the same y axis as the original series. ' The second series will be there to relate to the percentage labels of the first series to a percent axis so we set those ' element values to the percent values.
For Each el As Element In s.Elements runningSum += el.YValue Dim curEl As Element = New Element(el.Name,runningSum) curEl.SmartLabel.Text = (runningSum*100/sum).ToString("0") & "%" result.Elements.Add(curEl) result2.Elements.Add(New Element(el.Name,runningSum*100/sum))
Next el
result.Type = SeriesType.Line ' The visible series needs to be on the specified axis. result.YAxis = a
' Add the percentage axis. result2.YAxis = New Axis() result2.YAxis.Percent = True result2.YAxis.Orientation = dotnetCHARTING.Orientation.Right
' In order for the two axes to match the first series y axis will need to end at the running sum of the values. result.YAxis.Maximum = sum
' We dont really want to show the series on the chart so we will set the element colors to empty and get rid of the ' legend entry. result2.Type = SeriesType.Marker result2.DefaultElement.Color = Color.Empty result2.LegendEntry.Visible = False
' Add the series to a collection and return it. Dim sc As SeriesCollection = New SeriesCollection() sc.Add(result) sc.Add(result2)
Return sc End Function
Function getRandomData() As SeriesCollection Dim SC As SeriesCollection = New SeriesCollection() Dim myR As Random = New Random(1) For a As Integer = 1 To 1 Dim s As Series = New Series() s.Name = "Series " & a For b As Integer = 1 To 4 Dim e As Element = New Element() e.Name = "Element " & b 'e.YValue = -25 + myR.Next(50); e.YValue = myR.Next(50) s.Elements.Add(e) Next b SC.Add(s) Next a
Return SC End Function </script> </head> <body> <div style="text-align:center"> <dotnet:Chart id="Chart" runat="server" Width="568px" Height="344px"> </dotnet:Chart> </div> </body> </html>