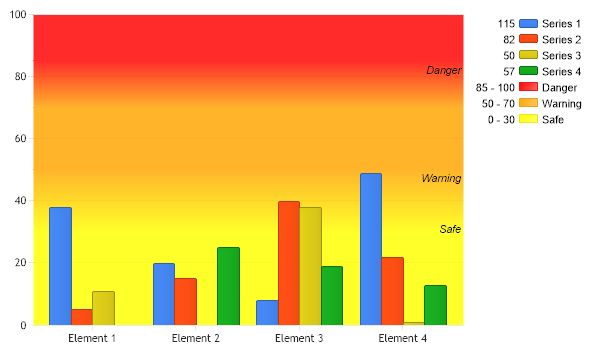
Axis Horizontal Color Bands
How axis markers can create gradient zones on the chart.
<%@ Page Language="C#" Description="dotnetCHARTING Component" %>
<%@ Register TagPrefix="dotnet" Namespace="dotnetCHARTING" Assembly="dotnetCHARTING"%>
<%@ Import Namespace="System.Drawing" %>
<html xmlns="http://www.w3.org/1999/xhtml">
<head>
<title>.netCHARTING Sample</title>
<script runat="server">
void Page_Load(Object sender,EventArgs e)
{
Chart.Type = ChartType.Combo;//Horizontal;
Chart.Width = 600;
Chart.Height = 350;
Chart.TempDirectory = "temp";
Chart.Debug = true;
Chart.YAxis.Maximum = 100;
Chart.YAxis.AlternateGridBackground.Color = Color.FromArgb(40,Color.White);
// Demonstrates how axis markers can create gradiant zones on the chart.
// The axis markers have solid colors and transition colors to blend between solid markers.
// am1, am3, and am4 are solid color markers while the others will be gradient color transition markers.
// Solid Markers
AxisMarker am1 = new AxisMarker("Danger", new Background(Color.Red,Color.Red,90),85,100);
AxisMarker am3 = new AxisMarker("Warning", new Background(Color.Orange,Color.Orange,90),50,70);
AxisMarker am5 = new AxisMarker("Safe", new Background(Color.Yellow,Color.Yellow,90),0,30);
// Color transition markers.
AxisMarker am2 = new AxisMarker("", new Background(Color.Red,Color.Orange,90),70,85);
AxisMarker am4 = new AxisMarker("", new Background(Color.Orange,Color.Yellow,90),30,50);
// Hide transition marker legend entries.
am2.LegendEntry.Visible = false;
am4.LegendEntry.Visible = false;
// Add all the markers.
Chart.YAxis.Markers.Add(am1, am2, am3, am4, am5);
// *DYNAMIC DATA NOTE*
// This sample uses random data to populate the chart. To populate
// a chart with database data see the following resources:
// - Classic samples folder
// - Help File > Data Tutorials
// - Sample: features/DataEngine.aspx
SeriesCollection mySC = getRandomData();
// Add the random data.
Chart.SeriesCollection.Add(mySC);
}
SeriesCollection getRandomData()
{
SeriesCollection SC = new SeriesCollection();
Random myR = new Random(2);
for(int a = 1; a < 5; a++)
{
Series s = new Series();
s.Name = "Series " + a;
for(int b = 1; b < 5; b++)
{
Element e = new Element();
e.Name = "Element " + b;
//e.YValue = -25 + myR.Next(50);
e.YValue = myR.Next(50);
s.Elements.Add(e);
}
SC.Add(s);
}
return SC;
}
</script>
</head>
<body>
<div style="text-align:center">
<dotnet:Chart id="Chart" runat="server" Width="568px" Height="344px">
</dotnet:Chart>
</div>
</body>
</html>
<%@ Page Language="vb" Description="dotnetCHARTING Component" %>
<%@ Register TagPrefix="dotnet" Namespace="dotnetCHARTING" Assembly="dotnetCHARTING"%>
<%@ Import Namespace="System.Drawing" %>
<html xmlns="http://www.w3.org/1999/xhtml">
<head>
<title>.netCHARTING Sample</title>
<script runat="server">
Sub Page_Load(ByVal sender As Object, ByVal e As EventArgs)
Chart.Type = ChartType.Combo 'Horizontal;
Chart.Width = 600
Chart.Height = 350
Chart.TempDirectory = "temp"
Chart.Debug = True
Chart.YAxis.Maximum = 100
Chart.YAxis.AlternateGridBackground.Color = Color.FromArgb(40,Color.White)
' Demonstrates how axis markers can create gradiant zones on the chart.
' The axis markers have solid colors and transition colors to blend between solid markers.
' am1, am3, and am4 are solid color markers while the others will be gradient color transition markers.
' Solid Markers
Dim am1 As AxisMarker = New AxisMarker("Danger", New Background(Color.Red,Color.Red,90),85,100)
Dim am3 As AxisMarker = New AxisMarker("Warning", New Background(Color.Orange,Color.Orange,90),50,70)
Dim am5 As AxisMarker = New AxisMarker("Safe", New Background(Color.Yellow,Color.Yellow,90),0,30)
' Color transition markers.
Dim am2 As AxisMarker = New AxisMarker("", New Background(Color.Red,Color.Orange,90),70,85)
Dim am4 As AxisMarker = New AxisMarker("", New Background(Color.Orange,Color.Yellow,90),30,50)
' Hide transition marker legend entries.
am2.LegendEntry.Visible = False
am4.LegendEntry.Visible = False
' Add all the markers.
Chart.YAxis.Markers.Add(am1, am2, am3, am4, am5)
' *DYNAMIC DATA NOTE*
' This sample uses random data to populate the chart. To populate
' a chart with database data see the following resources:
' - Classic samples folder
' - Help File > Data Tutorials
' - Sample: features/DataEngine.aspx
Dim mySC As SeriesCollection = getRandomData()
' Add the random data.
Chart.SeriesCollection.Add(mySC)
End Sub
Function getRandomData() As SeriesCollection
Dim SC As SeriesCollection = New SeriesCollection()
Dim myR As Random = New Random(2)
For a As Integer = 1 To 4
Dim s As Series = New Series()
s.Name = "Series " & a
For b As Integer = 1 To 4
Dim e As Element = New Element()
e.Name = "Element " & b
'e.YValue = -25 + myR.Next(50);
e.YValue = myR.Next(50)
s.Elements.Add(e)
Next b
SC.Add(s)
Next a
Return SC
End Function
</script>
</head>
<body>
<div style="text-align:center">
<dotnet:Chart id="Chart" runat="server" Width="568px" Height="344px">
</dotnet:Chart>
</div>
</body>
</html>