Gallery
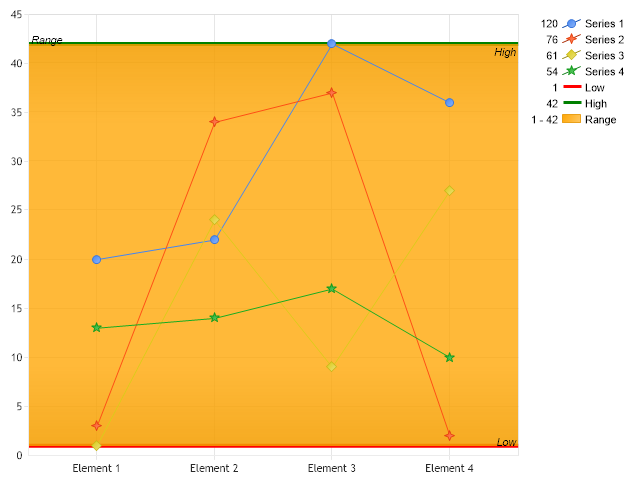
Dynamic Axis Markers
<%@ Page Language="C#" Description="dotnetCHARTING Component" %>
<%@ Register TagPrefix="dotnet" Namespace="dotnetCHARTING" Assembly="dotnetCHARTING"%>
<%@ Import Namespace="System.Drawing" %>
<script runat="server">
SeriesCollection getRandomData()
{
SeriesCollection SC = new SeriesCollection();
Random myR = new Random();
for(int a = 1; a < 5; a++)
{
Series s = new Series();
s.Name = "Series " + a;
for(int b = 1; b < 5; b++)
{
Element e = new Element();
e.Name = "Element " + b;
e.YValue = myR.Next(50);
s.Elements.Add(e);
}
SC.Add(s);
}
return SC;
}
void Page_Load(Object sender,EventArgs e)
{
Chart.Type = ChartType.Combo;//Horizontal;
Chart.TempDirectory = "temp";
Chart.Debug=true;
// Demonstrates how you can create dynamic axis markers based on the data.
// We'll set the default type to line so it can be viewed better.
Chart.DefaultSeries.Type = SeriesType.Line;
// First we get our data, if you would like to get the data from a database you need to use
// the data engine. See sample: features/dataEngine.aspx.
SeriesCollection sc = getRandomData();
// We now calculate and add the axis markers to the y axis.
// First we'll get single series calculations the highs and lows from the series collection.
Series highS = sc.Calculate("",Calculation.Maximum);
Series lowS = sc.Calculate("",Calculation.Minimum);
//Now from each series we can calculate high and low values as single elements.
// Because series.Calculate returns an element we use the yValue of the result
double high = highS.Calculate("",Calculation.Maximum).YValue;
double low = lowS.Calculate("",Calculation.Minimum).YValue;
// Add the markers to the y axis.
Chart.YAxis.Markers.Add(new AxisMarker("Low",new Line(Color.Red,4), low));
Chart.YAxis.Markers.Add(new AxisMarker("High",new Line(Color.Green,4), high));
// This code will add a range marker
Chart.YAxis.Markers.Add(new AxisMarker("Range", new Background(Color.Orange),low,high));
Chart.YAxis.Markers[2].Label.Alignment = StringAlignment.Near;
// Add the random data.
Chart.SeriesCollection.Add(sc);
}
</script>
<html xmlns="http://www.w3.org/1999/xhtml"><head><title>Dynamic Axis Marker</title></head>
<body>
<div style="text-align:center">
<dotnet:Chart id="Chart" runat="server"/>
</div>
</body>
</html>
<%@ Page Language="vb" Description="dotnetCHARTING Component" %>
<%@ Register TagPrefix="dotnet" Namespace="dotnetCHARTING" Assembly="dotnetCHARTING"%>
<%@ Import Namespace="System.Drawing" %>
<script runat="server">
Function getRandomData() As SeriesCollection
Dim SC As SeriesCollection = New SeriesCollection()
Dim myR As Random = New Random()
For a As Integer = 1 To 4
Dim s As Series = New Series()
s.Name = "Series " & a
For b As Integer = 1 To 4
Dim e As Element = New Element()
e.Name = "Element " & b
e.YValue = myR.Next(50)
s.Elements.Add(e)
Next b
SC.Add(s)
Next a
Return SC
End Function
Sub Page_Load(ByVal sender As Object, ByVal e As EventArgs)
Chart.Type = ChartType.Combo 'Horizontal;
Chart.TempDirectory = "temp"
Chart.Debug=True
' Demonstrates how you can create dynamic axis markers based on the data.
' We'll set the default type to line so it can be viewed better.
Chart.DefaultSeries.Type = SeriesType.Line
' First we get our data, if you would like to get the data from a database you need to use
' the data engine. See sample: features/dataEngine.aspx.
Dim sc As SeriesCollection = getRandomData()
' We now calculate and add the axis markers to the y axis.
' First we'll get single series calculations the highs and lows from the series collection.
Dim highS As Series = sc.Calculate("",Calculation.Maximum)
Dim lowS As Series = sc.Calculate("",Calculation.Minimum)
'Now from each series we can calculate high and low values as single elements.
' Because series.Calculate returns an element we use the yValue of the result
Dim high As Double = highS.Calculate("",Calculation.Maximum).YValue
Dim low As Double = lowS.Calculate("",Calculation.Minimum).YValue
' Add the markers to the y axis.
Chart.YAxis.Markers.Add(New AxisMarker("Low",New Line(Color.Red,4), low))
Chart.YAxis.Markers.Add(New AxisMarker("High",New Line(Color.Green,4), high))
' This code will add a range marker
Chart.YAxis.Markers.Add(New AxisMarker("Range", New Background(Color.Orange),low,high))
Chart.YAxis.Markers(2).Label.Alignment = StringAlignment.Near
' Add the random data.
Chart.SeriesCollection.Add(sc)
End Sub
</script>
<html xmlns="http://www.w3.org/1999/xhtml"><head><title>Dynamic Axis Marker</title></head>
<body>
<div style="text-align:center">
<dotnet:Chart id="Chart" runat="server"/>
</div>
</body>
</html>
- Sample FilenameDynamicAxisMarkers.aspx
- VersionLegacy (Pre 3.0)
- Uses DatabaseNo