// Demonstrates how to use AxisTicks associated with AxisMarkers.
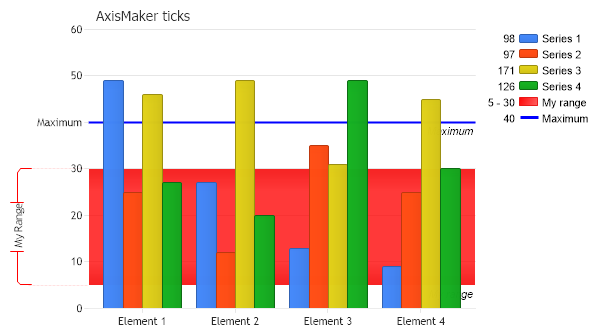
// 1. CREATE AND ADD AXIS MARKERS // A range marker AxisMarker am = new AxisMarker("My range",new Background(Color.Red),5,30);
Chart.YAxis.Markers.Add(am);
// A single value marker. AxisMarker am2 = new AxisMarker("Maximum",new Line(Color.Blue,2),40);
Chart.YAxis.Markers.Add(am2);
// 2. INSTANTIATE AXIS TICKS FOR MARKERS // This code will generate axis ticks for the markers at their positions. am.Tick = new AxisTick(); am.Tick.Label.Text = "My Range"; am.Tick.Line.Color = Color.Red; am2.Tick = new AxisTick(); am2.Tick.Label.Text = "Maximum";
// 3. ADD DATA // *DYNAMIC DATA NOTE* // This sample uses random data to populate the chart. To populate // a chart with database data see the following resources: // - Classic samples folder // - Help File > Data Tutorials // - Sample: features/DataEngine.aspx Chart.SeriesCollection.Add(getRandomData());
}
SeriesCollection getRandomData() { SeriesCollection SC = new SeriesCollection(); Random myR = new Random(); for(int a = 1; a < 5; a++) { Series s = new Series(); s.Name = "Series " + a; for(int b = 1; b < 5; b++) { Element e = new Element(); e.Name = "Element " + b; //e.YValue = -25 + myR.Next(50); e.YValue = myR.Next(50); s.Elements.Add(e); } SC.Add(s); }
' Demonstrates how to use AxisTicks associated with AxisMarkers.
' 1. CREATE AND ADD AXIS MARKERS ' A range marker Dim am As AxisMarker = New AxisMarker("My range",New Background(Color.Red),5,30)
Chart.YAxis.Markers.Add(am)
' A single value marker. Dim am2 As AxisMarker = New AxisMarker("Maximum",New Line(Color.Blue,2),40)
Chart.YAxis.Markers.Add(am2)
' 2. INSTANTIATE AXIS TICKS FOR MARKERS ' This code will generate axis ticks for the markers at their positions. am.Tick = New AxisTick() am.Tick.Label.Text = "My Range" am.Tick.Line.Color = Color.Red am2.Tick = New AxisTick() am2.Tick.Label.Text = "Maximum"
' 3. ADD DATA ' *DYNAMIC DATA NOTE* ' This sample uses random data to populate the chart. To populate ' a chart with database data see the following resources: ' - Classic samples folder ' - Help File > Data Tutorials ' - Sample: features/DataEngine.aspx Chart.SeriesCollection.Add(getRandomData())
End Sub
Function getRandomData() As SeriesCollection Dim SC As SeriesCollection = New SeriesCollection() Dim myR As Random = New Random() For a As Integer = 1 To 4 Dim s As Series = New Series() s.Name = "Series " & a For b As Integer = 1 To 4 Dim e As Element = New Element() e.Name = "Element " & b 'e.YValue = -25 + myR.Next(50); e.YValue = myR.Next(50) s.Elements.Add(e) Next b SC.Add(s) Next a
Return SC End Function </script> </head> <body> <div style="text-align:center"> <dotnet:Chart id="Chart" runat="server" Width="568px" Height="344px"> </dotnet:Chart> </div> </body> </html>