Title Box Legend Header
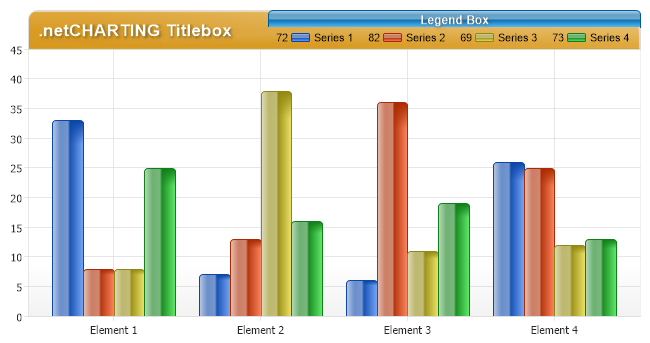
Demonstrates titlebox shading, corner sizing, text shadows and legend customizations.
<%@ Page Language="C#" Description="dotnetCHARTING Component" %>
<%@ Register TagPrefix="dotnet" Namespace="dotnetCHARTING" Assembly="dotnetCHARTING" %>
<%@ Import Namespace="System.Drawing" %>
<%@ Import Namespace="System.Drawing.Drawing2D" %>
<%@ Import Namespace="dotnetCHARTING.Mapping" %>
<script runat="server">
void Page_Load(Object sender, EventArgs e)
{
// Demonstrates titlebox shading, corner sizing, text shadows and legend customizations.
Chart.TempDirectory = "temp";
Chart.Debug = true;
//Chart Settings
Chart.Type = ChartType.Combo;
Chart.Size = "650x350";
Chart.ShadingEffectMode = ShadingEffectMode.Two;
Chart.Background.Color = Color.Transparent;
// Chart Area Customization
Chart.ChartArea.Background.Color = Color.White;
Chart.ChartArea.CornerBottomRight = BoxCorner.Round;
Chart.ChartArea.CornerBottomLeft = BoxCorner.Round;
Chart.DefaultSeries.Background.Color = Color.White;
Chart.DefaultElement.SmartLabel.Alignment = LabelAlignment.Center;
Chart.DefaultSeries.GaugeBorderBox.Padding = 5;
// TitleBox Customization
Chart.TitleBox.Label = new dotnetCHARTING.Label(".netCHARTING Titlebox", new Font("Arial", 13, FontStyle.Bold), Color.White);
Chart.TitleBox.Label.Shadow.Color = Color.FromArgb(105, 0, 0, 0);
Chart.TitleBox.Label.Shadow.Depth = 2;
Chart.TitleBox.Position = TitleBoxPosition.FullWithLegend;
Chart.TitleBox.CornerTopLeft = BoxCorner.Round;
Chart.TitleBox.CornerTopRight = BoxCorner.Round;
Chart.TitleBox.Background.ShadingEffectMode = ShadingEffectMode.Five;
Chart.TitleBox.Background.Color = Color.FromArgb(100, 225, 165, 50);
//Corner Size Customization (in pixels)
Chart.DefaultBox.CornerSize = 4;
Chart.TitleBox.CornerSize = 10;
// Legend Box Customization
Chart.LegendBox.HeaderLabel = new dotnetCHARTING.Label("Legend Box", new Font("Arial", 9, FontStyle.Bold), Color.White);
Chart.LegendBox.HeaderLabel.Alignment = StringAlignment.Center;
Chart.LegendBox.HeaderBackground.ShadingEffectMode = ShadingEffectMode.Two;
Chart.LegendBox.HeaderBackground.Color = Color.FromArgb(0, 156, 255);
Chart.LegendBox.HeaderLabel.Shadow.Color = Color.Gray;
Chart.LegendBox.HeaderLabel.Shadow.Depth = 1;
Chart.LegendBox.Background.Color = Color.White;
Chart.LegendBox.CornerTopLeft = BoxCorner.Round;
Chart.LegendBox.CornerTopRight = BoxCorner.Round;
// *DYNAMIC DATA NOTE*
// This sample uses random data to populate the chart. To populate
// a chart with database data see the following resources:
// - Use the getLiveData() method using the dataEngine to query a database.
// - Help File > Getting Started > Data Tutorials
// - DataEngine Class in the help file
// - Sample: features/DataEngine.aspx
SeriesCollection mySC = getRandomData();
// Add the random data.
Chart.SeriesCollection.Add(mySC);
}
SeriesCollection getRandomData()
{
Random myR = new Random(42);
SeriesCollection SC = new SeriesCollection();
for (int a = 1; a < 5; a++)
{
Series s = new Series("Series " + a.ToString());
s.Background.Color = Color.FromArgb(245, 245, 245);
for (int b = 1; b < 5; b++)
{
Element e = new Element("Element " + b.ToString());
e.YValue = myR.Next(50);
s.Elements.Add(e);
}
SC.Add(s);
}
return SC;
}
SeriesCollection getLiveData()
{
DataEngine de = new DataEngine("ConnectionString goes here");
de.ChartObject = Chart; // Necessary to view any errors the dataEngine may throw.
de.SqlStatement = "SELECT XAxisColumn, YAxisColumn FROM ....";
return de.GetSeries();
}
</script>
<html xmlns="http://www.w3.org/1999/xhtml">
<head>
<title>.netCHARTING Sample</title>
</head>
<body>
<div align="center">
<dotnet:Chart ID="Chart" runat="server" />
</div>
</body>
</html>
<%@ Page Language="vb" Description="dotnetCHARTING Component" %>
<%@ Register TagPrefix="dotnet" Namespace="dotnetCHARTING" Assembly="dotnetCHARTING" %>
<%@ Import Namespace="System.Drawing" %>
<%@ Import Namespace="System.Drawing.Drawing2D" %>
<%@ Import Namespace="dotnetCHARTING.Mapping" %>
<script runat="server">
Sub Page_Load(ByVal sender As Object, ByVal e As EventArgs)
' Demonstrates titlebox shading, corner sizing, text shadows and legend customizations.
Chart.TempDirectory = "temp"
Chart.Debug = True
'Chart Settings
Chart.Type = ChartType.Combo
Chart.Size = "650x350"
Chart.ShadingEffectMode = ShadingEffectMode.Two
Chart.Background.Color = Color.Transparent
' Chart Area Customization
Chart.ChartArea.Background.Color = Color.White
Chart.ChartArea.CornerBottomRight = BoxCorner.Round
Chart.ChartArea.CornerBottomLeft = BoxCorner.Round
Chart.DefaultSeries.Background.Color = Color.White
Chart.DefaultElement.SmartLabel.Alignment = LabelAlignment.Center
Chart.DefaultSeries.GaugeBorderBox.Padding = 5
' TitleBox Customization
Chart.TitleBox.Label = New dotnetCHARTING.Label(".netCHARTING Titlebox", New Font("Arial", 13, FontStyle.Bold), Color.White)
Chart.TitleBox.Label.Shadow.Color = Color.FromArgb(105, 0, 0, 0)
Chart.TitleBox.Label.Shadow.Depth = 2
Chart.TitleBox.Position = TitleBoxPosition.FullWithLegend
Chart.TitleBox.CornerTopLeft = BoxCorner.Round
Chart.TitleBox.CornerTopRight = BoxCorner.Round
Chart.TitleBox.Background.ShadingEffectMode = ShadingEffectMode.Five
Chart.TitleBox.Background.Color = Color.FromArgb(100, 225, 165, 50)
'Corner Size Customization (in pixels)
Chart.DefaultBox.CornerSize = 4
Chart.TitleBox.CornerSize = 10
' Legend Box Customization
Chart.LegendBox.HeaderLabel = New dotnetCHARTING.Label("Legend Box", New Font("Arial", 9, FontStyle.Bold), Color.White)
Chart.LegendBox.HeaderLabel.Alignment = StringAlignment.Center
Chart.LegendBox.HeaderBackground.ShadingEffectMode = ShadingEffectMode.Two
Chart.LegendBox.HeaderBackground.Color = Color.FromArgb(0, 156, 255)
Chart.LegendBox.HeaderLabel.Shadow.Color = Color.Gray
Chart.LegendBox.HeaderLabel.Shadow.Depth = 1
Chart.LegendBox.Background.Color = Color.White
Chart.LegendBox.CornerTopLeft = BoxCorner.Round
Chart.LegendBox.CornerTopRight = BoxCorner.Round
' *DYNAMIC DATA NOTE*
' This sample uses random data to populate the chart. To populate
' a chart with database data see the following resources:
' - Use the getLiveData() method using the dataEngine to query a database.
' - Help File > Getting Started > Data Tutorials
' - DataEngine Class in the help file
' - Sample: features/DataEngine.aspx
Dim mySC As SeriesCollection = getRandomData()
' Add the random data.
Chart.SeriesCollection.Add(mySC)
End Sub
Function getRandomData() As SeriesCollection
Dim myR As Random = New Random(42)
Dim SC As SeriesCollection = New SeriesCollection()
For a As Integer = 1 To 4
Dim s As Series = New Series("Series " & a.ToString())
s.Background.Color = Color.FromArgb(245, 245, 245)
For b As Integer = 1 To 4
Dim e As Element = New Element("Element " & b.ToString())
e.YValue = myR.Next(50)
s.Elements.Add(e)
Next b
SC.Add(s)
Next a
Return SC
End Function
Function getLiveData() As SeriesCollection
Dim de As DataEngine = New DataEngine("ConnectionString goes here")
de.ChartObject = Chart ' Necessary to view any errors the dataEngine may throw.
de.SqlStatement = "SELECT XAxisColumn, YAxisColumn FROM ...."
Return de.GetSeries()
End Function
</script>
<html xmlns="http://www.w3.org/1999/xhtml">
<head>
<title>.netCHARTING Sample</title>
</head>
<body>
<div align="center">
<dotnet:Chart ID="Chart" runat="server" />
</div>
</body>
</html>