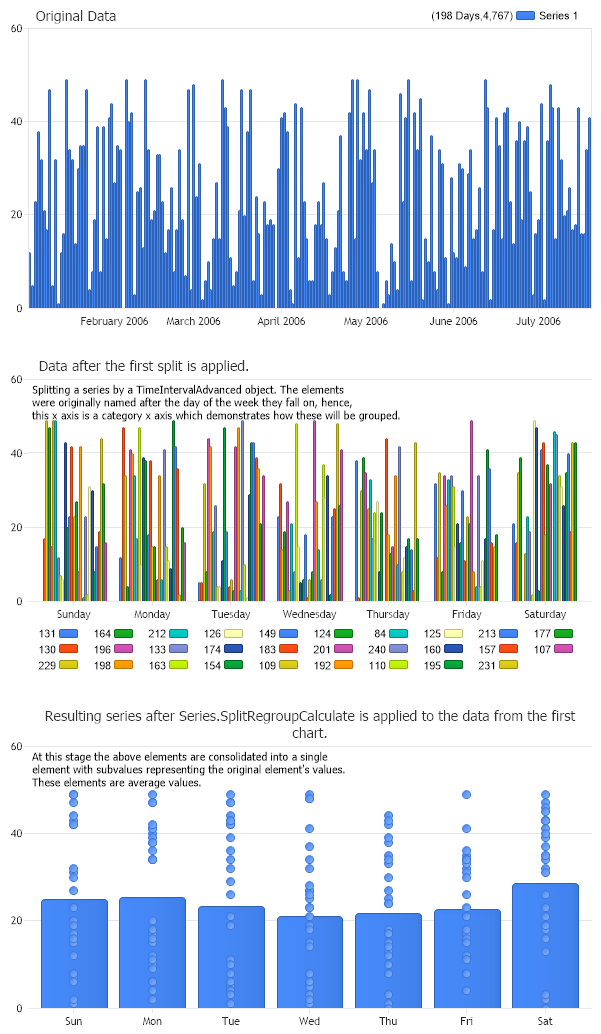
Chart.Title = "Original Data"; Chart1.Title = "Data after the first split is applied."; Chart2.Title = "Resulting series after Series.SplitRegroupCalculate is applied to the data from the first chart."; Chart1.ChartArea.Label.Text = "Splitting a series by a TimeIntervalAdvanced object. The elements \nwere originally named after the day of the week they fall on, hence, \nthis x axis is a category x axis which demonstrates how these will be grouped."; Chart2.ChartArea.Label.Text = "At this stage the above elements are consolidated into a single \nelement with subvalues representing the original element's values. \nThese elements are average values.";
// *DYNAMIC DATA NOTE* // This sample uses random data to populate the chart. To populate // a chart with database data see the following resources: // - Classic samples folder // - Help File > Data Tutorials // - Sample: features/DataEngine.aspx
SeriesCollection mySC = getRandomData();
Series splits = mySC[0].SplitRegroupCalculate(TimeIntervalAdvanced.Week,TimeIntervalAdvanced.Day,Calculation.Average,"ddd",true);
// Add the random data. Chart.SeriesCollection.Add(mySC); // original data Chart1.SeriesCollection.Add(mySC[0].Split(TimeIntervalAdvanced.Week)); // data split into weeks Chart2.SeriesCollection.Add(splits);// data after SplitRegroupCalculate processing
SeriesCollection getRandomData() { SeriesCollection SC = new SeriesCollection(); Random myR = new Random(1); DateTime dt = new DateTime(2006,1,1); for(int a = 1; a < 2; a++) { Series s = new Series(); s.Name = "Series " + a.ToString(); for(int b = 1; b < 200; b++) {dt = dt.AddDays(1); Element e = new Element(); e.Name = dt.DayOfWeek.ToString(); e.YValue = myR.Next(50); e.XDateTime = dt; s.Elements.Add(e); } SC.Add(s); }
Chart.Title = "Original Data" Chart1.Title = "Data after the first split is applied." Chart2.Title = "Resulting series after Series.SplitRegroupCalculate is applied to the data from the first chart." Chart1.ChartArea.Label.Text = "Splitting a series by a TimeIntervalAdvanced object. The elements " & Constants.vbLf & "were originally named after the day of the week they fall on, hence, " & Constants.vbLf & "this x axis is a category x axis which demonstrates how these will be grouped." Chart2.ChartArea.Label.Text = "At this stage the above elements are consolidated into a single " & Constants.vbLf & "element with subvalues representing the original element's values. " & Constants.vbLf & "These elements are average values."
' *DYNAMIC DATA NOTE* ' This sample uses random data to populate the chart. To populate ' a chart with database data see the following resources: ' - Classic samples folder ' - Help File > Data Tutorials ' - Sample: features/DataEngine.aspx
Dim mySC As SeriesCollection = getRandomData()
Dim splits As Series = mySC(0).SplitRegroupCalculate(TimeIntervalAdvanced.Week,TimeIntervalAdvanced.Day,Calculation.Average,"ddd",True)
' Add the random data. Chart.SeriesCollection.Add(mySC) ' original data Chart1.SeriesCollection.Add(mySC(0).Split(TimeIntervalAdvanced.Week)) ' data split into weeks Chart2.SeriesCollection.Add(splits) ' data after SplitRegroupCalculate processing
End Sub
Sub SetChart_Renamed(ByVal c As Chart) c.Type = ChartType.Combo c.Size = "600x350" c.TempDirectory = "temp" c.Debug = True 'c.Title = ".netCHARTING Sample"; End Sub
Function getRandomData() As SeriesCollection Dim SC As SeriesCollection = New SeriesCollection() Dim myR As Random = New Random(1) Dim dt As DateTime = New DateTime(2006,1,1) For a As Integer = 1 To 1 Dim s As Series = New Series() s.Name = "Series " & a.ToString() For b As Integer = 1 To 199 dt = dt.AddDays(1) Dim e As Element = New Element() e.Name = dt.DayOfWeek.ToString() e.YValue = myR.Next(50) e.XDateTime = dt s.Elements.Add(e) Next b SC.Add(s) Next a