SeriesCollection getRandomData() { SeriesCollection SC = new SeriesCollection(); Random myR = new Random(); for(int a = 1; a < 5; a++) { Series s = new Series(); s.Name = "Series " + a; for(int b = 1; b < 5; b++) { Element e = new Element(); e.Name = "Element " + b; //e.YValue = -25 + myR.Next(50); e.YValue = myR.Next(50); s.Elements.Add(e); } SC.Add(s); }
////////////////////// Using templates //////////////////////
// In this sample we will demonstrate how templates can be used.
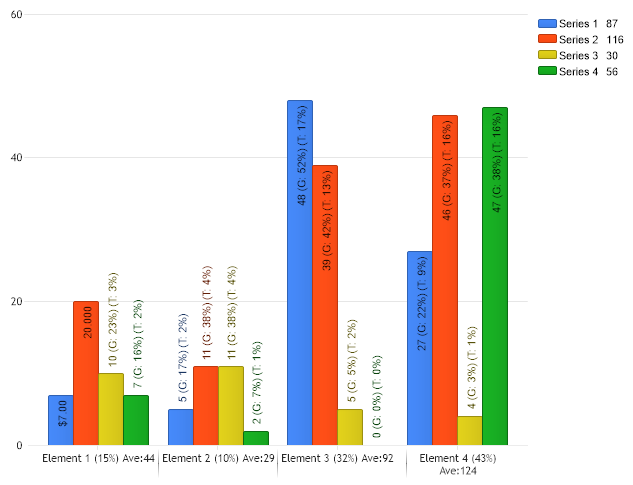
// Lets start with the x axis tick labels. The ticks are groups of elements with the same name. // For this group we will show what percentage of the total data this group represents with the // %YPercentOfTotal token. We will also show the average value of the group.
// The element labels can also be modified with these templates. Lets show the value, what percent the // group the element makes up and what percent of the total the element is.
// First in order to show the values we have to set the ShowValue property. Chart.DefaultSeries.DefaultElement.ShowValue = true;
Chart.DefaultSeries.DefaultElement.LabelTemplate = "%YValue (G: %YPercentOfGroup) (T: %YPercentOfTotal)"; // OR (These properties are the same) Chart.DefaultSeries.DefaultElement.SmartLabel.Text = "%YValue (G: %YPercentOfGroup) (T: %YPercentOfTotal)";
// Even more info can be shown by using templates in tool tips. These are supported for elements and legend entries.
// We'll add a tool tip to the elements here. Chart.DefaultSeries.DefaultElement.ToolTip = "%name is \r%YPercentOfSeries of %SeriesName";
// We can also add tool tips to the legend entries. Chart.DefaultSeries.LegendEntry.ToolTip = "- %name - \rAverage: %YAverage\rMedian: %YMedian\rMode: %YMode";
// Another useful template that can be set is LegendBox.Template. It will determine the layout of the legend // elements.
Chart.LegendBox.Template = "IconNameValue";
////////////////////// Embedding format string into templates //////////////////////
// We can embed format string into our chart by using this syntax: <(token),(FormatString)> // To demonstrate we will overwrite the 1st elements template to show the value as currency.
// To begin we will get our data SeriesCollection sc = getRandomData();
// The template will look like this: sc[0].Elements[0].LabelTemplate = "<%YValue,Currency>";
// Just another example for the second series sc[1].Elements[0].LabelTemplate = "<%YValue,{0:#0.000}>";
////////////////////// Creating clickable charts using templates //////////////////////
// We don�t have any where to redirect so lets pretend site.aspx is a website that will understand // the info we're going to send
Function getRandomData() As SeriesCollection Dim SC As SeriesCollection = New SeriesCollection() Dim myR As Random = New Random() For a As Integer = 1 To 4 Dim s As Series = New Series() s.Name = "Series " & a For b As Integer = 1 To 4 Dim e As Element = New Element() e.Name = "Element " & b 'e.YValue = -25 + myR.Next(50); e.YValue = myR.Next(50) s.Elements.Add(e) Next b SC.Add(s) Next a
Return SC End Function
Sub Page_Load(ByVal sender As Object, ByVal e As EventArgs)
'//////////////////// Using templates //////////////////////
' In this sample we will demonstrate how templates can be used.
' Lets start with the x axis tick labels. The ticks are groups of elements with the same name. ' For this group we will show what percentage of the total data this group represents with the ' %YPercentOfTotal token. We will also show the average value of the group.
' The element labels can also be modified with these templates. Lets show the value, what percent the ' group the element makes up and what percent of the total the element is.
' First in order to show the values we have to set the ShowValue property. Chart.DefaultSeries.DefaultElement.ShowValue = True
Chart.DefaultSeries.DefaultElement.LabelTemplate = "%YValue (G: %YPercentOfGroup) (T: %YPercentOfTotal)" ' OR (These properties are the same) Chart.DefaultSeries.DefaultElement.SmartLabel.Text = "%YValue (G: %YPercentOfGroup) (T: %YPercentOfTotal)"
' Even more info can be shown by using templates in tool tips. These are supported for elements and legend entries.
' We'll add a tool tip to the elements here. Chart.DefaultSeries.DefaultElement.ToolTip = "%name is " & Constants.vbCr & "%YPercentOfSeries of %SeriesName"
' We can also add tool tips to the legend entries. Chart.DefaultSeries.LegendEntry.ToolTip = "- %name - " & Constants.vbCr & "Average: %YAverage" & Constants.vbCr & "Median: %YMedian" & Constants.vbCr & "Mode: %YMode"
' Another useful template that can be set is LegendBox.Template. It will determine the layout of the legend ' elements.
Chart.LegendBox.Template = "IconNameValue"
'//////////////////// Embedding format string into templates //////////////////////
' We can embed format string into our chart by using this syntax: <(token),(FormatString)> ' To demonstrate we will overwrite the 1st elements template to show the value as currency.
' To begin we will get our data Dim sc As SeriesCollection = getRandomData()
' The template will look like this: sc(0).Elements(0).LabelTemplate = "<%YValue,Currency>"
' Just another example for the second series sc(1).Elements(0).LabelTemplate = "<%YValue,{0:#0.000}>"
'//////////////////// Creating clickable charts using templates //////////////////////
' We don�t have any where to redirect so lets pretend site.aspx is a website that will understand ' the info we're going to send
' Note: You may also use Element/LegendEntry.URLTarget = "_blank" for example to specify the link target.
' Add the random data. Chart.SeriesCollection.Add(sc)
End Sub </script> <html xmlns="http://www.w3.org/1999/xhtml"><head><title>Templates Tool Tip and Links</title></head> <body> <div style="text-align:center"> <dotnet:Chart id="Chart" runat="server"/> </div> </body> </html>