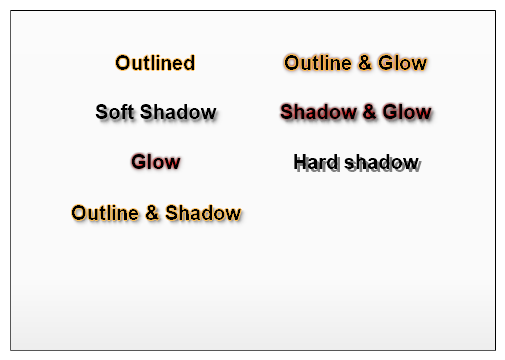
Label Styling
Demonstrates a number of text styling options available.
<%@ Page Language="C#" Description="dotnetCHARTING Component" %>
<%@ Register TagPrefix="dotnet" Namespace="dotnetCHARTING" Assembly="dotnetCHARTING" %>
<%@ Import Namespace="System.Drawing" %>
<%@ Import Namespace="System.Drawing.Drawing2D" %>
<%@ Import Namespace="dotnetCHARTING.Mapping" %>
<script runat="server">
void Page_Load(Object sender, EventArgs e)
{
// Demonstrates a number of text styling options available.
Chart.TempDirectory = "temp";
Chart.Debug = true;
Chart.Type = ChartType.Combo;
Chart.DefaultSeries.Type = SeriesType.Marker;
Chart.DefaultElement.Marker.Type = ElementMarkerType.None;
Chart.Size = "500x350";
//Chart.Title = ".netCHARTING Sample";
Chart.ChartArea.ClearColors();
Chart.ChartArea.Line.Color = Color.Black;
Chart.Palette = new Color[] { Color.Transparent };
Chart.LegendBox.Visible = false;
Chart.DefaultShadow.Color = Color.Empty;
Chart.DefaultAxis.ClearValues = true;
Chart.ChartArea.Background.Color = Color.FromArgb(250, 250, 250);
Chart.DefaultElement.Outline.Color = Color.Transparent;
Annotation a1 = getAnnotation("Outlined");
Annotation a2 = getAnnotation("Soft Shadow");
Annotation a3 = getAnnotation("Glow");
Annotation a4 = getAnnotation("Outline & Shadow");
Annotation a5 = getAnnotation("Outline & Glow");
Annotation a6 = getAnnotation("Shadow & Glow");
Annotation a7 = getAnnotation("Hard shadow");
a1.Position = new Point(50, 40);
a2.Position = new Point(50, 90);
a3.Position = new Point(50, 140);
a4.Position = new Point(50, 190);
a5.Position = new Point(250, 40);
a6.Position = new Point(250, 90);
a7.Position = new Point(250, 140);
a1.Label.Alignment= StringAlignment.Center;
a2.Label.Alignment= StringAlignment.Center;
a3.Label.Alignment= StringAlignment.Center;
a4.Label.Alignment= StringAlignment.Center;
a5.Label.Alignment= StringAlignment.Center;
a6.Label.Alignment= StringAlignment.Center;
a7.Label.Alignment= StringAlignment.Center;
Chart.Annotations.Add(a1, a2, a3, a4, a5, a6, a7);
Color outlineColor = Color.Orange;
Color shadowColor = Color.Gray;
Color glowColor = Color.Red;
int shadowDepth = 3;
a1.Label.OutlineColor = outlineColor;
a2.Label.Shadow.Color = shadowColor;
a2.Label.Shadow.Depth = shadowDepth;
a3.Label.GlowColor = glowColor;
a4.Label.OutlineColor = outlineColor;
a4.Label.Shadow.Color = shadowColor;
a4.Label.Shadow.Depth = shadowDepth;
a5.Label.OutlineColor = outlineColor;
a5.Label.GlowColor = glowColor;
a6.Label.Shadow.Color = shadowColor;
a6.Label.Shadow.Depth = shadowDepth;
a6.Label.GlowColor = glowColor;
a7.Label.Shadow.Color = shadowColor;
a7.Label.Shadow.Depth = shadowDepth;
a7.Label.Shadow.Soft = false;
// *DYNAMIC DATA NOTE*
// This sample uses random data to populate the chart. To populate
// a chart with database data see the following resources:
// - Help File > Getting Started > Data Tutorials
// - DataEngine Class in the help file
// - Sample: features/DataEngine.aspx
SeriesCollection mySC = getRandomData();
// Add the random data.
Chart.SeriesCollection.Add(mySC);
}
Annotation getAnnotation(string text)
{
Annotation an = new Annotation();
an.Label.Text = text;
an.ClearColors();
an.Label.Font = new Font("Arial", 15, FontStyle.Bold);
an.Size = new Size(200, 100);
return an;
}
SeriesCollection getRandomData()
{
Random myR = new Random(1);
SeriesCollection SC = new SeriesCollection();
int a = 0;
int b = 0;
for (a = 1; a < 2; a++)
{
Series s = new Series("Series " + a.ToString());
for (b = 1; b < 2; b++)
{
Element e = new Element("Element " + b.ToString());
e.YValue = myR.Next(50);
s.Elements.Add(e);
}
SC.Add(s);
}
return SC;
}
SeriesCollection getLiveData()
{
DataEngine de = new DataEngine("ConnectionString goes here");
de.ChartObject = Chart; // Necessary to view any errors the dataEngine may throw.
de.SqlStatement = "SELECT XAxisColumn, YAxisColumn FROM ....";
return de.GetSeries();
}
</script>
<html xmlns="http://www.w3.org/1999/xhtml">
<head>
<title>.netCHARTING Sample</title>
</head>
<body>
<div align="center">
<dotnet:Chart ID="Chart" runat="server" />
</div>
</body>
</html>
<%@ Page Language="vb" Description="dotnetCHARTING Component" %>
<%@ Register TagPrefix="dotnet" Namespace="dotnetCHARTING" Assembly="dotnetCHARTING" %>
<%@ Import Namespace="System.Drawing" %>
<%@ Import Namespace="System.Drawing.Drawing2D" %>
<%@ Import Namespace="dotnetCHARTING.Mapping" %>
<script runat="server">
Sub Page_Load(ByVal sender As Object, ByVal e As EventArgs)
' Demonstrates a number of text styling options available.
Chart.TempDirectory = "temp"
Chart.Debug = True
Chart.Type = ChartType.Combo
Chart.DefaultSeries.Type = SeriesType.Marker
Chart.DefaultElement.Marker.Type = ElementMarkerType.None
Chart.Size = "500x350"
'Chart.Title = ".netCHARTING Sample";
Chart.ChartArea.ClearColors()
Chart.ChartArea.Line.Color = Color.Black
Chart.Palette = New Color() { Color.Transparent }
Chart.LegendBox.Visible = False
Chart.DefaultShadow.Color = Color.Empty
Chart.DefaultAxis.ClearValues = True
Chart.ChartArea.Background.Color = Color.FromArgb(250, 250, 250)
Chart.DefaultElement.Outline.Color = Color.Transparent
Dim a1 As Annotation = getAnnotation("Outlined")
Dim a2 As Annotation = getAnnotation("Soft Shadow")
Dim a3 As Annotation = getAnnotation("Glow")
Dim a4 As Annotation = getAnnotation("Outline & Shadow")
Dim a5 As Annotation = getAnnotation("Outline & Glow")
Dim a6 As Annotation = getAnnotation("Shadow & Glow")
Dim a7 As Annotation = getAnnotation("Hard shadow")
a1.Position = New Point(50, 40)
a2.Position = New Point(50, 90)
a3.Position = New Point(50, 140)
a4.Position = New Point(50, 190)
a5.Position = New Point(250, 40)
a6.Position = New Point(250, 90)
a7.Position = New Point(250, 140)
a1.Label.Alignment= StringAlignment.Center
a2.Label.Alignment= StringAlignment.Center
a3.Label.Alignment= StringAlignment.Center
a4.Label.Alignment= StringAlignment.Center
a5.Label.Alignment= StringAlignment.Center
a6.Label.Alignment= StringAlignment.Center
a7.Label.Alignment= StringAlignment.Center
Chart.Annotations.Add(a1, a2, a3, a4, a5, a6, a7)
Dim outlineColor As Color = Color.Orange
Dim shadowColor As Color = Color.Gray
Dim glowColor As Color = Color.Red
Dim shadowDepth As Integer = 3
a1.Label.OutlineColor = outlineColor
a2.Label.Shadow.Color = shadowColor
a2.Label.Shadow.Depth = shadowDepth
a3.Label.GlowColor = glowColor
a4.Label.OutlineColor = outlineColor
a4.Label.Shadow.Color = shadowColor
a4.Label.Shadow.Depth = shadowDepth
a5.Label.OutlineColor = outlineColor
a5.Label.GlowColor = glowColor
a6.Label.Shadow.Color = shadowColor
a6.Label.Shadow.Depth = shadowDepth
a6.Label.GlowColor = glowColor
a7.Label.Shadow.Color = shadowColor
a7.Label.Shadow.Depth = shadowDepth
a7.Label.Shadow.Soft = False
' *DYNAMIC DATA NOTE*
' This sample uses random data to populate the chart. To populate
' a chart with database data see the following resources:
' - Help File > Getting Started > Data Tutorials
' - DataEngine Class in the help file
' - Sample: features/DataEngine.aspx
Dim mySC As SeriesCollection = getRandomData()
' Add the random data.
Chart.SeriesCollection.Add(mySC)
End Sub
Function getAnnotation(ByVal text As String) As Annotation
Dim an As Annotation = New Annotation()
an.Label.Text = text
an.ClearColors()
an.Label.Font = New Font("Arial", 15, FontStyle.Bold)
an.Size = New Size(200, 100)
Return an
End Function
Function getRandomData() As SeriesCollection
Dim myR As Random = New Random(1)
Dim SC As SeriesCollection = New SeriesCollection()
Dim a As Integer = 0
Dim b As Integer = 0
For a = 1 To 1
Dim s As Series = New Series("Series " & a.ToString())
For b = 1 To 1
Dim e As Element = New Element("Element " & b.ToString())
e.YValue = myR.Next(50)
s.Elements.Add(e)
Next b
SC.Add(s)
Next a
Return SC
End Function
Function getLiveData() As SeriesCollection
Dim de As DataEngine = New DataEngine("ConnectionString goes here")
de.ChartObject = Chart ' Necessary to view any errors the dataEngine may throw.
de.SqlStatement = "SELECT XAxisColumn, YAxisColumn FROM ...."
Return de.GetSeries()
End Function
</script>
<html xmlns="http://www.w3.org/1999/xhtml">
<head>
<title>.netCHARTING Sample</title>
</head>
<body>
<div align="center">
<dotnet:Chart ID="Chart" runat="server" />
</div>
</body>
</html>