Gallery
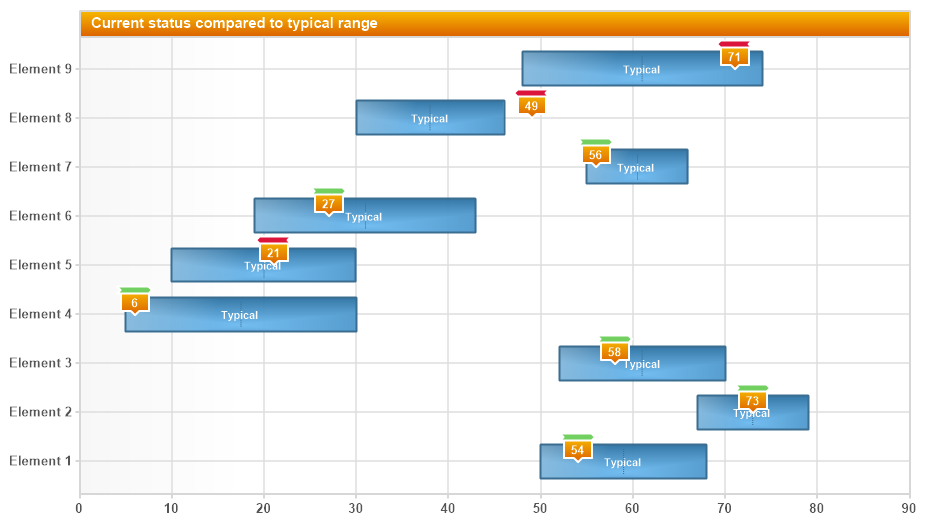
Styled Gantt
<%@ Page Language="C#" Description="dotnetCHARTING Component" %>
<%@ Register TagPrefix="dnc" Namespace="dotnetCHARTING" Assembly="dotnetCHARTING" %>
<%@ Import Namespace="System.Drawing" %>
<%@ Import Namespace="System.Drawing.Drawing2D" %>
<%@ Import Namespace="dotnetCHARTING.Mapping" %>
<script runat="server">
void Page_Load(Object sender, EventArgs e)
{
// Demonstrates using advanced styling to create a nice gantt chart with additional info.
Chart.Size = "930x524";
Chart.Title = "Current status compared to typical range";
Chart.TempDirectory = "temp";
Chart.Type = ChartType.ComboHorizontal;
Chart.ShadingEffectMode = ShadingEffectMode.One;
Chart.Debug = true;
Chart.Palette = new Color[] { Color.FromArgb(96, 180, 239), Color.FromArgb(0, 156, 255), Color.FromArgb(49, 255, 49), Color.FromArgb(255, 255, 0), Color.FromArgb(255, 99, 49) };
//Color.FromArgb(96, 180, 239),
Color lineColor = Color.FromArgb(215, 215, 215);
Chart.TitleBox.Label.Color = Color.White;
Chart.TitleBox.Line.Width = 2;
Chart.TitleBox.Line.Color = lineColor;
Chart.TitleBox.Position = TitleBoxPosition.Full;// WithLegend;
Chart.TitleBox.Label.Font = new Font("Arial", 11, FontStyle.Bold);
Chart.LegendBox.Visible = false;
Chart.ChartArea.Background.Color = Color.White;
// Chart.XAxis.AlternateGridBackground.Color = Color.Transparent;
Chart.TitleBox.Background.Color = Color.Transparent;
Chart.TitleBox.Background.ShadingEffectMode = ShadingEffectMode.None;
Chart.TitleBox.Shadow.Visible = false;
Chart.TitleBox.DefaultCorner = BoxCorner.Square;
Chart.TitleBox.Background = new Background(Color.FromArgb(248,186,0),Color.FromArgb(219,96,0),90);
Chart.DefaultAxis.DefaultTick.Label.Color = Color.FromArgb(85, 85, 85);
Chart.DefaultAxis.DefaultTick.Line.Color = lineColor;
Chart.DefaultAxis.Line.Width = 2;
Chart.DefaultAxis.Line.Color = lineColor;
Chart.DefaultAxis.DefaultTick.GridLine.Width = 2;
Chart.DefaultAxis.DefaultTick.Line.Width = 2;
Chart.DefaultAxis.DefaultTick.Label.Font = new Font("Arial", 10, FontStyle.Bold);
Chart.ChartArea.Line.Color = lineColor;
Chart.ChartArea.Line.Width = 2;
Chart.YAxis.SpacingPercentage = 30;
Chart.DefaultElement.Outline.Width = 2;
Chart.DefaultElement.DefaultSubValue.Type = SubValueType.Line;
Chart.DefaultElement.DefaultSubValue.Line.Length = 25;
Chart.DefaultElement.DefaultSubValue.Line.DashStyle = DashStyle.Dot;
// *DYNAMIC DATA NOTE*
// This sample uses random data to populate the chart. To populate
// a chart with database data see the following resources:
// - Use the getLiveData() method using the dataEngine to query a database.
// - Help File > Getting Started > Data Tutorials
// - DataEngine Class in the help file
// - Sample: features/DataEngine.aspx
SeriesCollection mySC = getRandomData();
mySC[1].Type = SeriesType.Marker;
Annotation an = new Annotation();
mySC[1].DefaultElement.Annotation = an;
mySC[1].DefaultElement.Marker.Type = ElementMarkerType.None;
mySC[1].LegendEntry.SeriesType = SeriesType.Bar;
mySC[1].LegendEntry.Background.Color = Color.Orange;
mySC[1].DefaultElement.Outline.Color = Color.White;
an.Label.Text = "%YValue";
an.Orientation = dotnetCHARTING.Orientation.Top;
an.DefaultCorner = BoxCorner.Square;
an.Label.Color = Color.White;
an.Label.Font = new Font("Arial", 9, FontStyle.Bold);
an.Line.Color = Color.White;
an.Line.Width = 2;
an.CornerSize = 10;
an.Background = new Background(Color.FromArgb(248,186,0),Color.FromArgb(219,96,0),90);
an.Shadow.Color = Color.FromArgb(100,Color.LightGray);
an.Header.Label.Text = "<Chart:Spacer size='1x1'>";
an.Padding = 2;
for(int i = 0; i < mySC[0].Elements.Count;i++)
{
Element el = mySC[0][i];
if (el.YValueStart+(el.YValue - el.YValueStart)/2 < mySC[1][i].YValue)
{
mySC[1][i].Annotation = new Annotation("%YValue", an);
styleBoxHigh(mySC[1][i].Annotation);
}
}
styleBoxOK(an);
//an.Background.Color = ;
//an.Background.SecondaryColor = ;
mySC[0].DefaultElement.ShowValue = true;
mySC[0].DefaultElement.SmartLabel.Alignment = LabelAlignment.Center;
mySC[0].DefaultElement.SmartLabel.Text = "Typical";
mySC[0].DefaultElement.SmartLabel.Color = Color.White;
mySC[0].DefaultElement.SmartLabel.Font = new Font("Arial", 8, FontStyle.Bold);
// Add the random data.
Chart.SeriesCollection.Add(mySC);
}
private void styleBoxOK(dotnetCHARTING.Box b)
{
b.Padding = 2;
b.Header.VerticalAlignment = EdgeAlignment.Edge;
b.Header.EndCap = BoxCapStyle.Triangle;
b.Header.StartCap = BoxCapStyle.TriangleInverted;
b.Header.Background.Color = Color.FromArgb(114,208,97);
b.Header.Line.Width = 2;
b.Header.Line.Color = Color.White;
}
private void styleBoxHigh(dotnetCHARTING.Box b)
{
b.Padding = 2;
b.Header.VerticalAlignment = EdgeAlignment.Edge;
b.Header.StartCap = BoxCapStyle.Triangle;
b.Header.EndCap = BoxCapStyle.TriangleInverted;
b.Header.Background.Color = Color.FromArgb(220, 20, 60);
b.Header.Line.Width = 2;
}
SeriesCollection getRandomData()
{
Random myR = new Random(2);
SeriesCollection SC = new SeriesCollection();
Series s2 = new Series("Current");
Series s = new Series("Typical");
for (int b = 1; b < 10; b++)
{
Element e = new Element("Element " + b.ToString());
e.YValue = 30+myR.Next(50);
e.YValueStart = e.YValue - (10 + myR.Next(20));
e.SubValues.Add(SubValue.FromValue (e.YValueStart+(e.YValue - e.YValueStart)/2));
s.Elements.Add(e);
Element e2 = new Element("Element " + b.ToString());
e2.YValue = e.YValueStart + myR.Next((int)(e.YValue - e.YValueStart)+10);
s2.Elements.Add(e2);
}
SC.Add(s);
SC.Add(s2);
return SC;
}
SeriesCollection getLiveData()
{
DataEngine de = new DataEngine(ConfigurationManager.AppSettings["DNCConnectionString"]);
de.ChartObject = Chart; // Necessary to view any errors the dataEngine may throw.
de.SqlStatement = "SELECT XAxisColumn, YAxisColumn FROM ....";
return de.GetSeries();
}
</script>
<html xmlns="http://www.w3.org/1999/xhtml">
<head>
<title>.netCHARTING Sample</title>
</head>
<style type="text/css">
div, p
{
font-family: Arial, Helvetica, sans-serif;
font-size: x-small;
}
</style>
<body>
<div align="center">
<dnc:Chart ID="Chart" runat="server" />
</div>
</body>
</html>
<%@ Page Language="vb" Description="dotnetCHARTING Component" %>
<%@ Register TagPrefix="dnc" Namespace="dotnetCHARTING" Assembly="dotnetCHARTING" %>
<%@ Import Namespace="System.Drawing" %>
<%@ Import Namespace="System.Drawing.Drawing2D" %>
<%@ Import Namespace="dotnetCHARTING.Mapping" %>
<script runat="server">
Sub Page_Load(ByVal sender As Object, ByVal e As EventArgs)
' Demonstrates using advanced styling to create a nice gantt chart with additional info.
Chart.Size = "930x524"
Chart.Title = "Current status compared to typical range"
Chart.TempDirectory = "temp"
Chart.Type = ChartType.ComboHorizontal
Chart.ShadingEffectMode = ShadingEffectMode.One
Chart.Debug = True
Chart.Palette = New Color() { Color.FromArgb(96, 180, 239), Color.FromArgb(0, 156, 255), Color.FromArgb(49, 255, 49), Color.FromArgb(255, 255, 0), Color.FromArgb(255, 99, 49) }
'Color.FromArgb(96, 180, 239),
Dim lineColor As Color = Color.FromArgb(215, 215, 215)
Chart.TitleBox.Label.Color = Color.White
Chart.TitleBox.Line.Width = 2
Chart.TitleBox.Line.Color = lineColor
Chart.TitleBox.Position = TitleBoxPosition.Full ' WithLegend;
Chart.TitleBox.Label.Font = New Font("Arial", 11, FontStyle.Bold)
Chart.LegendBox.Visible = False
Chart.ChartArea.Background.Color = Color.White
' Chart.XAxis.AlternateGridBackground.Color = Color.Transparent;
Chart.TitleBox.Background.Color = Color.Transparent
Chart.TitleBox.Background.ShadingEffectMode = ShadingEffectMode.None
Chart.TitleBox.Shadow.Visible = False
Chart.TitleBox.DefaultCorner = BoxCorner.Square
Chart.TitleBox.Background = New Background(Color.FromArgb(248,186,0),Color.FromArgb(219,96,0),90)
Chart.DefaultAxis.DefaultTick.Label.Color = Color.FromArgb(85, 85, 85)
Chart.DefaultAxis.DefaultTick.Line.Color = lineColor
Chart.DefaultAxis.Line.Width = 2
Chart.DefaultAxis.Line.Color = lineColor
Chart.DefaultAxis.DefaultTick.GridLine.Width = 2
Chart.DefaultAxis.DefaultTick.Line.Width = 2
Chart.DefaultAxis.DefaultTick.Label.Font = New Font("Arial", 10, FontStyle.Bold)
Chart.ChartArea.Line.Color = lineColor
Chart.ChartArea.Line.Width = 2
Chart.YAxis.SpacingPercentage = 30
Chart.DefaultElement.Outline.Width = 2
Chart.DefaultElement.DefaultSubValue.Type = SubValueType.Line
Chart.DefaultElement.DefaultSubValue.Line.Length = 25
Chart.DefaultElement.DefaultSubValue.Line.DashStyle = DashStyle.Dot
' *DYNAMIC DATA NOTE*
' This sample uses random data to populate the chart. To populate
' a chart with database data see the following resources:
' - Use the getLiveData() method using the dataEngine to query a database.
' - Help File > Getting Started > Data Tutorials
' - DataEngine Class in the help file
' - Sample: features/DataEngine.aspx
Dim mySC As SeriesCollection = getRandomData()
mySC(1).Type = SeriesType.Marker
Dim an As Annotation = New Annotation()
mySC(1).DefaultElement.Annotation = an
mySC(1).DefaultElement.Marker.Type = ElementMarkerType.None
mySC(1).LegendEntry.SeriesType = SeriesType.Bar
mySC(1).LegendEntry.Background.Color = Color.Orange
mySC(1).DefaultElement.Outline.Color = Color.White
an.Label.Text = "%YValue"
an.Orientation = dotnetCHARTING.Orientation.Top
an.DefaultCorner = BoxCorner.Square
an.Label.Color = Color.White
an.Label.Font = New Font("Arial", 9, FontStyle.Bold)
an.Line.Color = Color.White
an.Line.Width = 2
an.CornerSize = 10
an.Background = New Background(Color.FromArgb(248,186,0),Color.FromArgb(219,96,0),90)
an.Shadow.Color = Color.FromArgb(100,Color.LightGray)
an.Header.Label.Text = "<Chart:Spacer size='1x1'>"
an.Padding = 2
For i As Integer = 0 To mySC(0).Elements.Count - 1
Dim el As Element = mySC(0)(i)
If el.YValueStart+(el.YValue - el.YValueStart)/2 < mySC(1)(i).YValue Then
mySC(1)(i).Annotation = New Annotation("%YValue", an)
styleBoxHigh(mySC(1)(i).Annotation)
End If
Next i
styleBoxOK(an)
'an.Background.Color = ;
'an.Background.SecondaryColor = ;
mySC(0).DefaultElement.ShowValue = True
mySC(0).DefaultElement.SmartLabel.Alignment = LabelAlignment.Center
mySC(0).DefaultElement.SmartLabel.Text = "Typical"
mySC(0).DefaultElement.SmartLabel.Color = Color.White
mySC(0).DefaultElement.SmartLabel.Font = New Font("Arial", 8, FontStyle.Bold)
' Add the random data.
Chart.SeriesCollection.Add(mySC)
End Sub
Private Sub styleBoxOK(ByVal b As dotnetCHARTING.Box)
b.Padding = 2
b.Header.VerticalAlignment = EdgeAlignment.Edge
b.Header.EndCap = BoxCapStyle.Triangle
b.Header.StartCap = BoxCapStyle.TriangleInverted
b.Header.Background.Color = Color.FromArgb(114,208,97)
b.Header.Line.Width = 2
b.Header.Line.Color = Color.White
End Sub
Private Sub styleBoxHigh(ByVal b As dotnetCHARTING.Box)
b.Padding = 2
b.Header.VerticalAlignment = EdgeAlignment.Edge
b.Header.StartCap = BoxCapStyle.Triangle
b.Header.EndCap = BoxCapStyle.TriangleInverted
b.Header.Background.Color = Color.FromArgb(220, 20, 60)
b.Header.Line.Width = 2
End Sub
Function getRandomData() As SeriesCollection
Dim myR As Random = New Random(2)
Dim SC As SeriesCollection = New SeriesCollection()
Dim s2 As Series = New Series("Current")
Dim s As Series = New Series("Typical")
For b As Integer = 1 To 9
Dim e As Element = New Element("Element " & b.ToString())
e.YValue = 30+myR.Next(50)
e.YValueStart = e.YValue - (10 + myR.Next(20))
e.SubValues.Add(SubValue.FromValue (e.YValueStart+(e.YValue - e.YValueStart)/2))
s.Elements.Add(e)
Dim e2 As Element = New Element("Element " & b.ToString())
e2.YValue = e.YValueStart + myR.Next(CInt(Fix(e.YValue - e.YValueStart))+10)
s2.Elements.Add(e2)
Next b
SC.Add(s)
SC.Add(s2)
Return SC
End Function
Function getLiveData() As SeriesCollection
Dim de As DataEngine = New DataEngine(ConfigurationManager.AppSettings("DNCConnectionString"))
de.ChartObject = Chart ' Necessary to view any errors the dataEngine may throw.
de.SqlStatement = "SELECT XAxisColumn, YAxisColumn FROM ...."
Return de.GetSeries()
End Function
</script>
<html xmlns="http://www.w3.org/1999/xhtml">
<head>
<title>.netCHARTING Sample</title>
</head>
<style type="text/css">
div, p
{
font-family: Arial, Helvetica, sans-serif;
font-size: x-small;
}
</style>
<body>
<div align="center">
<dnc:Chart ID="Chart" runat="server" />
</div>
</body>
</html>
- Sample FilenameStyledGantt.aspx
- Version7.0
- Uses DatabaseNo