Gallery
Splitby
<%@ Page Language="C#" Description="dotnetCHARTING Component"%>
<%@ Register TagPrefix="dotnet" Namespace="dotnetCHARTING" Assembly="dotnetCHARTING"%>
<%@ Import Namespace="System.Drawing" %>
<script runat="server">
void Page_Load(Object sender,EventArgs e)
{
//set global properties
Chart.Title="Sales";
Chart.ChartArea.YAxis.Label.Text="Sales";
Chart.ChartArea.YAxis.FormatString="Currency";
Chart.TempDirectory="temp";
Chart.Debug=true;
Chart.DefaultSeries.DefaultElement.Transparency=15;
Chart.ChartArea.YAxis.Scale = Scale.Stacked;
Chart.TitleBox.Position = TitleBoxPosition.FullWithLegend;
Chart.DateGrouping = TimeInterval.Year;
Chart.Use3D=true;
//Add a series
Chart.Series.ConnectionString = ConfigurationManager.AppSettings["DNCConnectionString"];
Chart.Series.StartDate=new System.DateTime(2022,1,1,0,0,0);
Chart.Series.EndDate = new System.DateTime(2022,12,31,23,59,59);
Chart.Series.Name="Sales";
Chart.Series.SqlStatement= @"SELECT OrderDate,Sum(Total) FROM Orders WHERE OrderDate >= #STARTDATE# AND OrderDate <= #ENDDATE# GROUP BY Orders.OrderDate, Orders.Name";
Chart.SeriesCollection.Add();
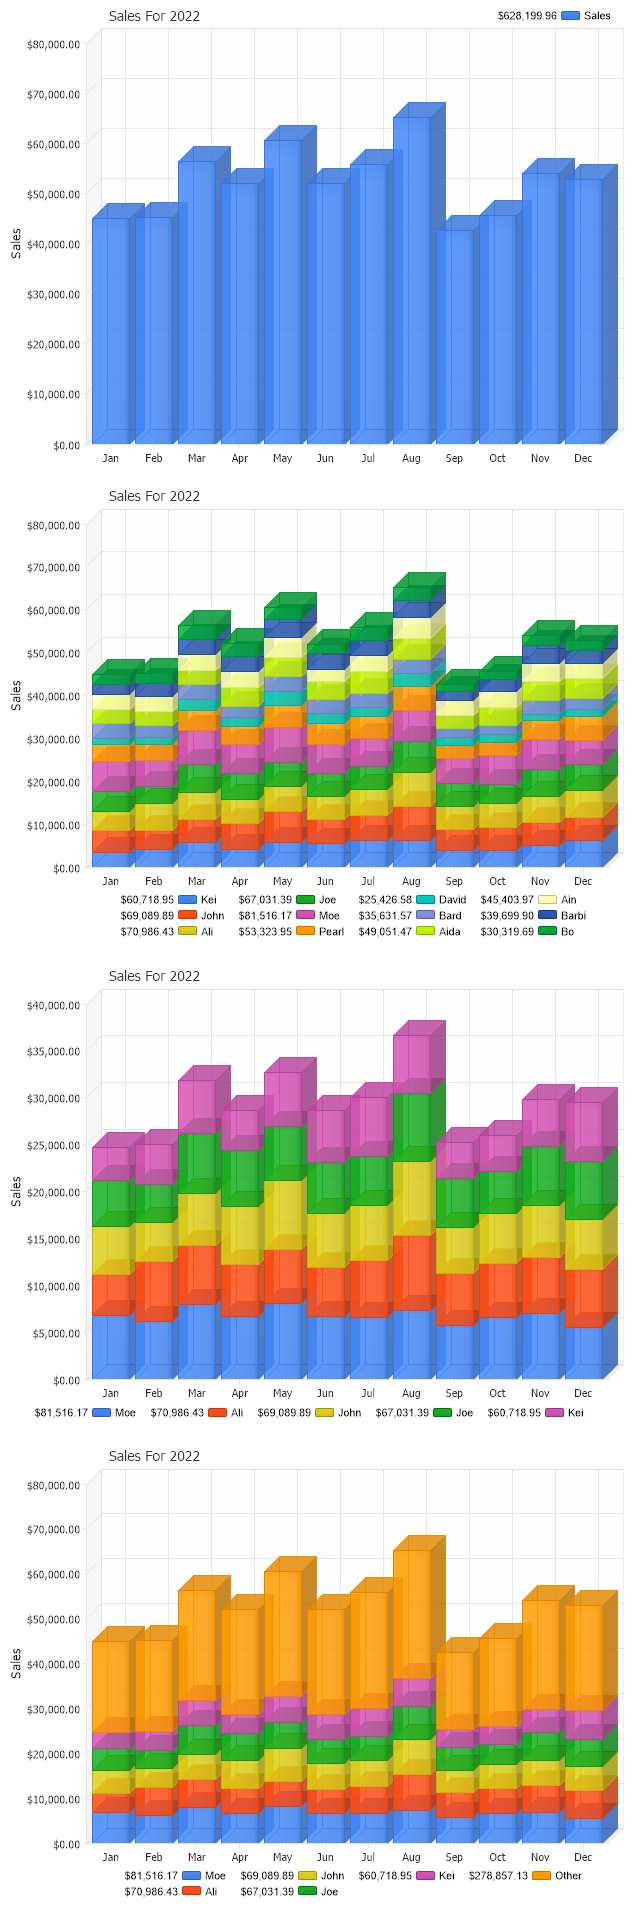
//This is the same chart with "Name" added to the SQL statement,
//it will automatically split the data into series based on Name.
//set global properties
Chart2.Title="Sales";
Chart2.ChartArea.YAxis.Label.Text="Sales";
Chart2.ChartArea.YAxis.FormatString="Currency";
Chart2.TempDirectory="temp";
Chart2.Debug=true;
Chart2.DefaultSeries.DefaultElement.Transparency=15;
Chart2.ChartArea.YAxis.Scale = Scale.Stacked;
Chart2.LegendBox.Position=LegendBoxPosition.BottomMiddle;
Chart2.DateGrouping = TimeInterval.Year;
Chart2.Use3D=true;
//Add a series
Chart2.Series.ConnectionString = ConfigurationManager.AppSettings["DNCConnectionString"];
Chart2.Series.StartDate=new System.DateTime(2022,1,1,0,0,0);
Chart2.Series.EndDate = new System.DateTime(2022,12,31,23,59,59);
Chart2.Series.SqlStatement= @"SELECT OrderDate,Sum(Total),Name FROM Orders WHERE OrderDate >= #STARTDATE# AND OrderDate <= #ENDDATE# GROUP BY Orders.OrderDate, Orders.Name";
Chart2.SeriesCollection.Add();
//This is the same chart with the SplitByLimit property set
//this will limit the number of series generated, in this case 5.
//set global properties
Chart3.Title="Sales";
Chart3.ChartArea.YAxis.Label.Text="Sales";
Chart3.ChartArea.YAxis.FormatString="Currency";
Chart3.TempDirectory="temp";
Chart3.Debug=true;
Chart3.DefaultSeries.DefaultElement.Transparency=15;
Chart3.ChartArea.YAxis.Scale = Scale.Stacked;
Chart3.LegendBox.Position=LegendBoxPosition.BottomMiddle;
Chart3.DateGrouping = TimeInterval.Year;
Chart3.Use3D=true;
//Add a series
Chart3.Series.ConnectionString = ConfigurationManager.AppSettings["DNCConnectionString"];
Chart3.Series.StartDate=new System.DateTime(2022,1,1,0,0,0);
Chart3.Series.EndDate = new System.DateTime(2022,12,31,23,59,59);
Chart3.Series.SqlStatement= @"SELECT OrderDate,Sum(Total),Name FROM Orders WHERE OrderDate >= #STARTDATE# AND OrderDate <= #ENDDATE# GROUP BY Orders.OrderDate, Orders.Name";
Chart3.Series.SplitByLimit="5";
Chart3.SeriesCollection.Add();
//This is the same chart with ShowOther enabled. This will
//split the data into 5 series (number determined by SplitByLimit) and
//group the values for all other values into an "Other" Series.
//set global properties
Chart4.Title="Sales";
Chart4.ChartArea.YAxis.Label.Text="Sales";
Chart4.ChartArea.YAxis.FormatString="Currency";
Chart4.TempDirectory="temp";
Chart4.Debug=true;
Chart4.DefaultSeries.DefaultElement.Transparency=15;
Chart4.ChartArea.YAxis.Scale = Scale.Stacked;
Chart4.LegendBox.Position=LegendBoxPosition.BottomMiddle;
Chart4.DateGrouping = TimeInterval.Year;
Chart4.Use3D=true;
//Add a series
Chart4.Series.ConnectionString = ConfigurationManager.AppSettings["DNCConnectionString"];
Chart4.Series.StartDate=new System.DateTime(2022,1,1,0,0,0);
Chart4.Series.EndDate = new System.DateTime(2022,12,31,23,59,59);
Chart4.Series.SqlStatement= @"SELECT OrderDate,Sum(Total),Name FROM Orders WHERE OrderDate >= #STARTDATE# AND OrderDate <= #ENDDATE# GROUP BY Orders.OrderDate, Orders.Name";
Chart4.Series.SplitByLimit="5";
Chart4.Series.ShowOther = true;
Chart4.SeriesCollection.Add();
}
</script>
<html xmlns="http://www.w3.org/1999/xhtml"><head><title>SplitBy and ShowOther Sample</title></head>
<body>
<div style="text-align:center">
<dotnet:Chart id="Chart" runat="server"/>
</div>
<div style="text-align:center">
<dotnet:Chart id="Chart2" runat="server"/>
</div>
<div style="text-align:center">
<dotnet:Chart id="Chart3" runat="server"/>
</div>
<div style="text-align:center">
<dotnet:Chart id="Chart4" runat="server"/>
</div>
</body>
</html>
<%@ Page Language="vb" Description="dotnetCHARTING Component"%>
<%@ Register TagPrefix="dotnet" Namespace="dotnetCHARTING" Assembly="dotnetCHARTING"%>
<%@ Import Namespace="System.Drawing" %>
<script runat="server">
Sub Page_Load(ByVal sender As Object, ByVal e As EventArgs)
'set global properties
Chart.Title="Sales"
Chart.ChartArea.YAxis.Label.Text="Sales"
Chart.ChartArea.YAxis.FormatString="Currency"
Chart.TempDirectory="temp"
Chart.Debug=True
Chart.DefaultSeries.DefaultElement.Transparency=15
Chart.ChartArea.YAxis.Scale = Scale.Stacked
Chart.TitleBox.Position = TitleBoxPosition.FullWithLegend
Chart.DateGrouping = TimeInterval.Year
Chart.Use3D=True
'Add a series
Chart.Series.ConnectionString = ConfigurationManager.AppSettings("DNCConnectionString")
Chart.Series.StartDate = New System.DateTime(2022,1,1,0,0,0)
Chart.Series.EndDate = New System.DateTime(2022,12,31,23,59,59)
Chart.Series.Name="Sales"
Chart.Series.SqlStatement= "SELECT OrderDate,Sum(Total) FROM Orders WHERE OrderDate >= #STARTDATE# AND OrderDate <= #ENDDATE# GROUP BY Orders.OrderDate, Orders.Name"
Chart.SeriesCollection.Add()
'This is the same chart with "Name" added to the SQL statement,
'it will automatically split the data into series based on Name.
'set global properties
Chart2.Title="Sales"
Chart2.ChartArea.YAxis.Label.Text="Sales"
Chart2.ChartArea.YAxis.FormatString="Currency"
Chart2.TempDirectory="temp"
Chart2.Debug=True
Chart2.DefaultSeries.DefaultElement.Transparency=15
Chart2.ChartArea.YAxis.Scale = Scale.Stacked
Chart2.LegendBox.Position=LegendBoxPosition.BottomMiddle
Chart2.DateGrouping = TimeInterval.Year
Chart2.Use3D=True
'Add a series
Chart2.Series.ConnectionString = ConfigurationManager.AppSettings("DNCConnectionString")
Chart2.Series.StartDate = New System.DateTime(2022,1,1,0,0,0)
Chart2.Series.EndDate = New System.DateTime(2022,12,31,23,59,59)
Chart2.Series.SqlStatement= "SELECT OrderDate,Sum(Total),Name FROM Orders WHERE OrderDate >= #STARTDATE# AND OrderDate <= #ENDDATE# GROUP BY Orders.OrderDate, Orders.Name"
Chart2.SeriesCollection.Add()
'This is the same chart with the SplitByLimit property set
'this will limit the number of series generated, in this case 5.
'set global properties
Chart3.Title="Sales"
Chart3.ChartArea.YAxis.Label.Text="Sales"
Chart3.ChartArea.YAxis.FormatString="Currency"
Chart3.TempDirectory="temp"
Chart3.Debug=True
Chart3.DefaultSeries.DefaultElement.Transparency=15
Chart3.ChartArea.YAxis.Scale = Scale.Stacked
Chart3.LegendBox.Position=LegendBoxPosition.BottomMiddle
Chart3.DateGrouping = TimeInterval.Year
Chart3.Use3D=True
'Add a series
Chart3.Series.ConnectionString = ConfigurationManager.AppSettings("DNCConnectionString")
Chart3.Series.StartDate = New System.DateTime(2022,1,1,0,0,0)
Chart3.Series.EndDate = New System.DateTime(2022,12,31,23,59,59)
Chart3.Series.SqlStatement= "SELECT OrderDate,Sum(Total),Name FROM Orders WHERE OrderDate >= #STARTDATE# AND OrderDate <= #ENDDATE# GROUP BY Orders.OrderDate, Orders.Name"
Chart3.Series.SplitByLimit="5"
Chart3.SeriesCollection.Add()
'This is the same chart with ShowOther enabled. This will
'split the data into 5 series (number determined by SplitByLimit) and
'group the values for all other values into an "Other" Series.
'set global properties
Chart4.Title="Sales"
Chart4.ChartArea.YAxis.Label.Text="Sales"
Chart4.ChartArea.YAxis.FormatString="Currency"
Chart4.TempDirectory="temp"
Chart4.Debug=True
Chart4.DefaultSeries.DefaultElement.Transparency=15
Chart4.ChartArea.YAxis.Scale = Scale.Stacked
Chart4.LegendBox.Position=LegendBoxPosition.BottomMiddle
Chart4.DateGrouping = TimeInterval.Year
Chart4.Use3D=True
'Add a series
Chart4.Series.ConnectionString = ConfigurationManager.AppSettings("DNCConnectionString")
Chart4.Series.StartDate = New System.DateTime(2022,1,1,0,0,0)
Chart4.Series.EndDate = New System.DateTime(2022,12,31,23,59,59)
Chart4.Series.SqlStatement= "SELECT OrderDate,Sum(Total),Name FROM Orders WHERE OrderDate >= #STARTDATE# AND OrderDate <= #ENDDATE# GROUP BY Orders.OrderDate, Orders.Name"
Chart4.Series.SplitByLimit="5"
Chart4.Series.ShowOther = True
Chart4.SeriesCollection.Add()
End Sub
</script>
<html xmlns="http://www.w3.org/1999/xhtml"><head><title>SplitBy and ShowOther Sample</title></head>
<body>
<div style="text-align:center">
<dotnet:Chart id="Chart" runat="server"/>
</div>
<div style="text-align:center">
<dotnet:Chart id="Chart2" runat="server"/>
</div>
<div style="text-align:center">
<dotnet:Chart id="Chart3" runat="server"/>
</div>
<div style="text-align:center">
<dotnet:Chart id="Chart4" runat="server"/>
</div>
</body>
</html>
- Sample Filenamesplitby.aspx
- VersionLegacy (Pre 3.0)
- Uses DatabaseYes