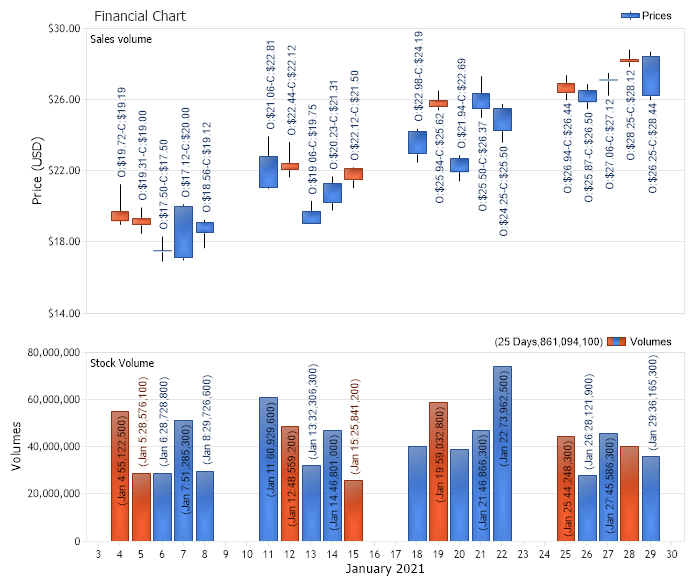
Financial DB
Demonstrates how to use a database to generate a financial chart.
<%@ Page Language="C#" Description="dotnetCHARTING Component" %>
<%@ Register TagPrefix="dotnet" Namespace="dotnetCHARTING" Assembly="dotnetCHARTING"%>
<%@ Import Namespace="System.Drawing" %>
<html xmlns="http://www.w3.org/1999/xhtml">
<head>
<title>.netCHARTING Sample</title>
<script runat="server">
void Page_Load(Object sender,EventArgs e)
{
// Demonstrates how to use a database to generate a financial chart.
FinancialChart.Title="Financial Chart";
FinancialChart.TempDirectory="temp";
FinancialChart.Debug=true;
FinancialChart.ShadingEffect = true;
FinancialChart.LegendBox.Template ="%icon %name";
FinancialChart.Size="700X600";
FinancialChart.DefaultElement.Marker.Visible = false;
FinancialChart.DefaultElement.ShowValue = true;
FinancialChart.XAxis.Scale = Scale.Time;
FinancialChart.XAxis.TimeInterval = TimeInterval.Days;
// Set the time padding for the x axis.
FinancialChart.ChartArea.XAxis.TimePadding = new TimeSpan(1,0,0,0);
//Customize volume area
FinancialChart.ChartArea.Label.Text="Sales volume";
FinancialChart.ChartArea.XAxis.FormatString = "%d";
FinancialChart.ChartArea.XAxis.Label.Text ="January 2021";
FinancialChart.TitleBox.Position = TitleBoxPosition.FullWithLegend;
FinancialChart.DefaultChartArea.TitleBox.Position = TitleBoxPosition.FullWithLegend;
FinancialChart.YAxis.Label.Text = "Price (USD)";
FinancialChart.YAxis.FormatString = "currency";
FinancialChart.YAxis.Scale = Scale.Range;
DataEngine priceDataEngine = new DataEngine ();
priceDataEngine.ChartObject = FinancialChart;
priceDataEngine.ChartType = ChartType.Financial;
priceDataEngine.ConnectionString = ConfigurationManager.AppSettings["DNCConnectionString"];
priceDataEngine.DateGrouping = TimeInterval.Day;
priceDataEngine.StartDate = new DateTime (2021,1,2);
priceDataEngine.EndDate = new DateTime (2021,1,31,23,59,59);
priceDataEngine.SqlStatement = @"SELECT TransDate, HighPrice, LowPrice, OpenPrice, ClosePrice, Volume FROM FinancialCompany WHERE TransDate >= #STARTDATE# AND TransDate <= #ENDDATE# ORDER BY TransDate DESC";
priceDataEngine.DataFields = "xAxis=TransDate,High=HighPrice,Low=LowPrice,Open=OpenPrice,Close=ClosePrice,Volume=Volume";
SeriesCollection sc = priceDataEngine.GetSeries ();
Series prices = null;
if(sc.Count>0)
prices = sc[0];
else
return;
prices.DefaultElement.ShowValue=true;
prices.DefaultElement.ToolTip="L:%Low-H:%High";
prices.DefaultElement.SmartLabel.Text="O:%Open-C:%Close";
prices.Type = SeriesTypeFinancial.CandleStick;
CalendarPattern cp = new CalendarPattern (TimeInterval.Day, TimeInterval.Week, "0000001");
//prices.Trim (cp, ElementValue.XDateTime);
prices.Name = "Prices";
FinancialChart.SeriesCollection.Add (prices);
// Create the second chart area
ChartArea volumeChartArea = new ChartArea();
volumeChartArea.Label.Text = "Stock Volume";
volumeChartArea.YAxis.Label.Text = "Volumes";
volumeChartArea.YAxis.FormatString = "n0";
volumeChartArea.HeightPercentage = 40;
volumeChartArea.DefaultElement.ToolTip="%YValue";
FinancialChart.ExtraChartAreas.Add(volumeChartArea);
Series volumes = new Series("Volumes");
foreach(Element el in prices.Elements)
{
Element newEl = new Element();
newEl.YValue = el.Volume;
newEl.XDateTime = el.XDateTime;
if (el.Close < el.Open)
newEl.Color = Color.FromArgb(254, 76, 20);
else
newEl.Color = Color.FromArgb(66, 133, 244);
volumes.Elements.Add(newEl);
}
volumes.Name = "Volumes";
volumes.Type = SeriesType.Bar;
volumes.DefaultElement.LabelTemplate="(<%XValue,MMM d>:%YValue)";
volumes.DefaultElement.ShowValue = true;
volumeChartArea.SeriesCollection.Add (volumes);
}
</script>
</head>
<body>
<div style="text-align:center">
<dotnet:Chart id="FinancialChart" runat="server"/>
</div>
</body>
</html>
<%@ Page Language="vb" Description="dotnetCHARTING Component" %>
<%@ Register TagPrefix="dotnet" Namespace="dotnetCHARTING" Assembly="dotnetCHARTING"%>
<%@ Import Namespace="System.Drawing" %>
<html xmlns="http://www.w3.org/1999/xhtml">
<head>
<title>.netCHARTING Sample</title>
<script runat="server">
Sub Page_Load(ByVal sender As Object, ByVal e As EventArgs)
' Demonstrates how to use a database to generate a financial chart.
FinancialChart.Title="Financial Chart"
FinancialChart.TempDirectory="temp"
FinancialChart.Debug=True
FinancialChart.ShadingEffect = True
FinancialChart.LegendBox.Template ="%icon %name"
FinancialChart.Size="700X600"
FinancialChart.DefaultElement.Marker.Visible = False
FinancialChart.DefaultElement.ShowValue = True
FinancialChart.XAxis.Scale = Scale.Time
FinancialChart.XAxis.TimeInterval = TimeInterval.Days
' Set the time padding for the x axis.
FinancialChart.ChartArea.XAxis.TimePadding = New TimeSpan(1,0,0,0)
'Customize volume area
FinancialChart.ChartArea.Label.Text="Sales volume"
FinancialChart.ChartArea.XAxis.FormatString = "%d"
FinancialChart.ChartArea.XAxis.Label.Text ="January 2021"
FinancialChart.TitleBox.Position = TitleBoxPosition.FullWithLegend
FinancialChart.DefaultChartArea.TitleBox.Position = TitleBoxPosition.FullWithLegend
FinancialChart.YAxis.Label.Text = "Price (USD)"
FinancialChart.YAxis.FormatString = "currency"
FinancialChart.YAxis.Scale = Scale.Range
Dim priceDataEngine As DataEngine = New DataEngine ()
priceDataEngine.ChartObject = FinancialChart
priceDataEngine.ChartType = ChartType.Financial
priceDataEngine.ConnectionString = ConfigurationManager.AppSettings("DNCConnectionString")
priceDataEngine.DateGrouping = TimeInterval.Day
priceDataEngine.StartDate = New DateTime (2021,1,2)
priceDataEngine.EndDate = New DateTime (2021,1,31,23,59,59)
priceDataEngine.SqlStatement = "SELECT TransDate, HighPrice, LowPrice, OpenPrice, ClosePrice, Volume FROM FinancialCompany WHERE TransDate >= #STARTDATE# AND TransDate <= #ENDDATE# ORDER BY TransDate DESC"
priceDataEngine.DataFields = "xAxis=TransDate,High=HighPrice,Low=LowPrice,Open=OpenPrice,Close=ClosePrice,Volume=Volume"
Dim sc As SeriesCollection = priceDataEngine.GetSeries ()
Dim prices As Series = Nothing
If sc.Count>0 Then
prices = sc(0)
Else
Return
End If
prices.DefaultElement.ShowValue=True
prices.DefaultElement.ToolTip="L:%Low-H:%High"
prices.DefaultElement.SmartLabel.Text="O:%Open-C:%Close"
prices.Type = SeriesTypeFinancial.CandleStick
Dim cp As CalendarPattern = New CalendarPattern (TimeInterval.Day, TimeInterval.Week, "0000001")
'prices.Trim (cp, ElementValue.XDateTime);
prices.Name = "Prices"
FinancialChart.SeriesCollection.Add (prices)
' Create the second chart area
Dim volumeChartArea As ChartArea = New ChartArea()
volumeChartArea.Label.Text = "Stock Volume"
volumeChartArea.YAxis.Label.Text = "Volumes"
volumeChartArea.YAxis.FormatString = "n0"
volumeChartArea.HeightPercentage = 40
volumeChartArea.DefaultElement.ToolTip="%YValue"
FinancialChart.ExtraChartAreas.Add(volumeChartArea)
Dim volumes As Series = New Series("Volumes")
For Each el As Element In prices.Elements
Dim newEl As Element = New Element()
newEl.YValue = el.Volume
newEl.XDateTime = el.XDateTime
If el.Close < el.Open Then
newEl.Color = Color.FromArgb(254, 76, 20)
Else
newEl.Color = Color.FromArgb(66, 133, 244)
End If
volumes.Elements.Add(newEl)
Next el
volumes.Name = "Volumes"
volumes.Type = SeriesType.Bar
volumes.DefaultElement.LabelTemplate="(<%XValue,MMM d>:%YValue)"
volumes.DefaultElement.ShowValue = True
volumeChartArea.SeriesCollection.Add (volumes)
End Sub
</script>
</head>
<body>
<div style="text-align:center">
<dotnet:Chart id="FinancialChart" runat="server"/>
</div>
</body>
</html>