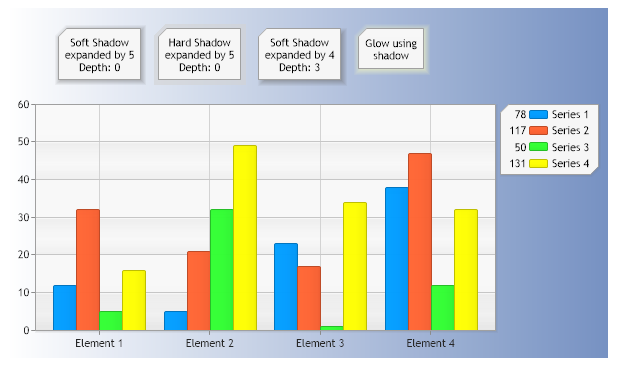
Chart.Size = "600x350"; Chart.MarginTop = 90; Chart.TempDirectory = "temp"; Chart.Debug = true; Chart.Background = new Background(Color.White, Color.FromArgb(118,145,194), 0); Chart.LegacyMode = true; // Add Annotations with different shadows. Annotation an = new Annotation("Soft Shadow expanded by 5\nDepth: 0"); an.Shadow.ExpandBy = 5; an.Position = new Point(50, 20); Chart.Annotations.Add(an);
Annotation an2 = new Annotation("Hard Shadow expanded by 5\nDepth: 0"); an2.Shadow.ExpandBy = 5; an2.Position = new Point(150, 20); an2.Shadow.Soft = false; an2.Shadow.Color = Color.FromArgb(150, Color.LightGray); Chart.Annotations.Add(an2);
Annotation an3 = new Annotation("Soft Shadow expanded by 4\nDepth: 3"); an3.Shadow.ExpandBy = 4; an3.Shadow.Depth = 3; an3.Position = new Point(250, 20); Chart.Annotations.Add(an3);
Annotation an4 = new Annotation("Glow using shadow"); an4.Shadow.ExpandBy = 6; an4.Position = new Point(350, 20); an4.Shadow.Color = Color.FromArgb(200, 255, 255, 190); Chart.Annotations.Add(an4);
// *DYNAMIC DATA NOTE* // This sample uses random data to populate the chart. To populate // a chart with database data see the following resources: // - Use the getLiveData() method using the dataEngine to query a database. // - Help File > Getting Started > Data Tutorials // - DataEngine Class in the help file // - Sample: features/DataEngine.aspx
SeriesCollection mySC = getRandomData();
// Add the random data. Chart.SeriesCollection.Add(mySC); }
SeriesCollection getRandomData() { Random myR = new Random(1); SeriesCollection SC = new SeriesCollection(); for (int a = 1; a < 5; a++) { Series s = new Series("Series " + a.ToString()); for (int b = 1; b < 5; b++) { Element e = new Element("Element " + b.ToString()); e.YValue = myR.Next(50); s.Elements.Add(e); } SC.Add(s); } return SC; }
SeriesCollection getLiveData() { DataEngine de = new DataEngine(ConfigurationManager.AppSettings["DNCConnectionString"]); de.ChartObject = Chart; // Necessary to view any errors the dataEngine may throw. de.SqlStatement = "SELECT XAxisColumn, YAxisColumn FROM ...."; return de.GetSeries(); }
Sub Page_Load(ByVal sender As Object, ByVal e As EventArgs) ' Demonstrates the shadow expansion feature.
Chart.Size = "600x350" Chart.MarginTop = 90 Chart.TempDirectory = "temp" Chart.Debug = True Chart.Background = New Background(Color.White, Color.FromArgb(118,145,194), 0) Chart.LegacyMode = True ' Add Annotations with different shadows. Dim an As Annotation = New Annotation("Soft Shadow expanded by 5" & Constants.vbLf & "Depth: 0") an.Shadow.ExpandBy = 5 an.Position = New Point(50, 20) Chart.Annotations.Add(an)
Dim an2 As Annotation = New Annotation("Hard Shadow expanded by 5" & Constants.vbLf & "Depth: 0") an2.Shadow.ExpandBy = 5 an2.Position = New Point(150, 20) an2.Shadow.Soft = False an2.Shadow.Color = Color.FromArgb(150, Color.LightGray) Chart.Annotations.Add(an2)
Dim an3 As Annotation = New Annotation("Soft Shadow expanded by 4" & Constants.vbLf & "Depth: 3") an3.Shadow.ExpandBy = 4 an3.Shadow.Depth = 3 an3.Position = New Point(250, 20) Chart.Annotations.Add(an3)
Dim an4 As Annotation = New Annotation("Glow using shadow") an4.Shadow.ExpandBy = 6 an4.Position = New Point(350, 20) an4.Shadow.Color = Color.FromArgb(200, 255, 255, 190) Chart.Annotations.Add(an4)
' *DYNAMIC DATA NOTE* ' This sample uses random data to populate the chart. To populate ' a chart with database data see the following resources: ' - Use the getLiveData() method using the dataEngine to query a database. ' - Help File > Getting Started > Data Tutorials ' - DataEngine Class in the help file ' - Sample: features/DataEngine.aspx
Dim mySC As SeriesCollection = getRandomData()
' Add the random data. Chart.SeriesCollection.Add(mySC) End Sub
Function getRandomData() As SeriesCollection Dim myR As Random = New Random(1) Dim SC As SeriesCollection = New SeriesCollection() For a As Integer = 1 To 4 Dim s As Series = New Series("Series " & a.ToString()) For b As Integer = 1 To 4 Dim e As Element = New Element("Element " & b.ToString()) e.YValue = myR.Next(50) s.Elements.Add(e) Next b SC.Add(s) Next a Return SC End Function
Function getLiveData() As SeriesCollection Dim de As DataEngine = New DataEngine(ConfigurationManager.AppSettings("DNCConnectionString")) de.ChartObject = Chart ' Necessary to view any errors the dataEngine may throw. de.SqlStatement = "SELECT XAxisColumn, YAxisColumn FROM ...." Return de.GetSeries() End Function