void Page_Load(Object sender,EventArgs e) { // Demonstrates how grid positions can be specified for multiple chart areas. Chart.Type = ChartType.Combo;//Horizontal; Chart.Width = 500; Chart.Height = 350; Chart.TempDirectory = "temp"; Chart.Debug = true; Chart.ChartArea.Line = new Line(Color.LightGray, 1); Chart.TitleBox.Background.Color = Color.FromArgb(10, 240, 240, 240); Chart.TitleBox.Position = TitleBoxPosition.FullWithLegend;
// *DYNAMIC DATA NOTE* // This sample uses random data to populate the chart. To populate // a chart with database data see the following resources: // - Classic samples folder // - Help File > Data Tutorials // - Sample: features/DataEngine.aspx SeriesCollection mySC = getRandomData();
// First we create a new chart area and add it. ChartArea ca1 = new ChartArea(); ca1.TitleBox.Background.Color = Color.FromArgb(10, 240, 240, 240); ca1.TitleBox.Position = TitleBoxPosition.FullWithLegend; ca1.Line = new Line(Color.LightGray, 1); Chart.ExtraChartAreas.Add(ca1);
// In order to use grid positions the custom layout mode must be specified. Chart.ChartAreaLayout.Mode = ChartAreaLayoutMode.Custom;
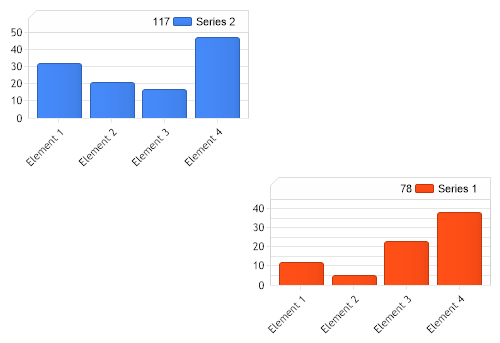
// The main chart area will be in position 0,0 (this is the default position) Chart.ChartArea.GridPosition = new Point(0,0); // The second chart area's position will be 1,1 ca1.GridPosition = new Point(1,1);
// Add the random a series each the custom chart area and main chart area. ca1.SeriesCollection.Add(mySC[0]); Chart.SeriesCollection.Add(mySC[1]);
}
SeriesCollection getRandomData() { SeriesCollection SC = new SeriesCollection(); Random myR = new Random(1); for(int a = 1; a < 3; a++) { Series s = new Series(); s.Name = "Series " + a; for(int b = 1; b < 5; b++) { Element e = new Element(); e.Name = "Element " + b; e.YValue = myR.Next(50); s.Elements.Add(e); } SC.Add(s); }
Sub Page_Load(ByVal sender As Object, ByVal e As EventArgs) ' Demonstrates how grid positions can be specified for multiple chart areas. Chart.Type = ChartType.Combo 'Horizontal; Chart.Width = 500 Chart.Height = 350 Chart.TempDirectory = "temp" Chart.Debug = True Chart.ChartArea.Line = New Line(Color.LightGray, 1) Chart.TitleBox.Background.Color = Color.FromArgb(10, 240, 240, 240) Chart.TitleBox.Position = TitleBoxPosition.FullWithLegend
' *DYNAMIC DATA NOTE* ' This sample uses random data to populate the chart. To populate ' a chart with database data see the following resources: ' - Classic samples folder ' - Help File > Data Tutorials ' - Sample: features/DataEngine.aspx Dim mySC As SeriesCollection = getRandomData()
' First we create a new chart area and add it. Dim ca1 As ChartArea = New ChartArea() ca1.TitleBox.Background.Color = Color.FromArgb(10, 240, 240, 240) ca1.TitleBox.Position = TitleBoxPosition.FullWithLegend ca1.Line = New Line(Color.LightGray, 1) Chart.ExtraChartAreas.Add(ca1)
' In order to use grid positions the custom layout mode must be specified. Chart.ChartAreaLayout.Mode = ChartAreaLayoutMode.Custom
' The main chart area will be in position 0,0 (this is the default position) Chart.ChartArea.GridPosition = New Point(0,0) ' The second chart area's position will be 1,1 ca1.GridPosition = New Point(1,1)
' Add the random a series each the custom chart area and main chart area. ca1.SeriesCollection.Add(mySC(0)) Chart.SeriesCollection.Add(mySC(1))
End Sub
Function getRandomData() As SeriesCollection Dim SC As SeriesCollection = New SeriesCollection() Dim myR As Random = New Random(1) For a As Integer = 1 To 2 Dim s As Series = New Series() s.Name = "Series " & a For b As Integer = 1 To 4 Dim e As Element = New Element() e.Name = "Element " & b e.YValue = myR.Next(50) s.Elements.Add(e) Next b SC.Add(s) Next a
Return SC End Function </script> </head> <body> <div style="text-align:center"> <dotnet:Chart id="Chart" runat="server" Width="568px" Height="344px"> </dotnet:Chart> </div> </body> </html>