Gallery
SelectiveDefaultsSC
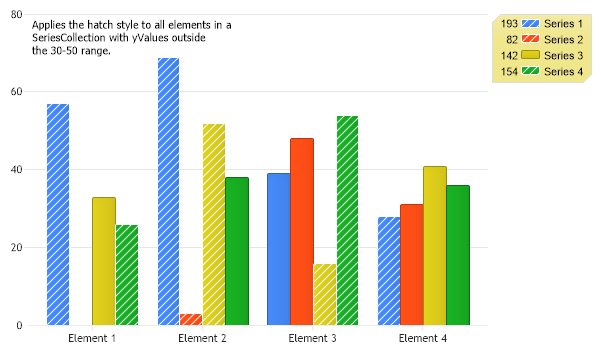
Demonstrates applying element settings to a set of elements in a series collection that meet a specific criteria.
- Sample FilenameSelectiveDefaultsSC.aspx
- Version5.0
- Uses DatabaseNo