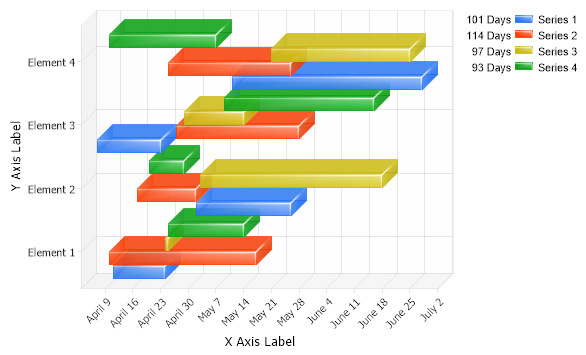
<script runat="server"> void Page_Load(Object sender,EventArgs e) { // Demonstrates range bars with shading effect mode Five. // Set the title. //Chart.Title="My Chart";
// Set the chart Type Chart.Type = ChartType.ComboHorizontal;
// Turn 3D on. Chart.Use3D = true; Chart.ShadingEffectMode = ShadingEffectMode.Five;
// Set a default transparency Chart.DefaultElement.Transparency = 30;
// Set the x axis label Chart.XAxis.Label.Text="X Axis Label";
// Set the y axis label Chart.YAxis.Label.Text="Y Axis Label";
// Set the x axis scale to time. Chart.XAxis.Scale = Scale.Time;
// Set the directory where the images will be stored. Chart.TempDirectory="temp";
// Set the chart size. Chart.Width = 600; Chart.Height = 350;
// Add the random data. Chart.SeriesCollection.Add(getRandomData());
}
SeriesCollection getRandomData() { SeriesCollection SC = new SeriesCollection(); Random myR = new Random(); for(int a = 1; a < 5; a++) { Series s = new Series(); s.Name = "Series " + a; for(int b = 1; b < 5; b++) { Element e = new Element(); e.Name = "Element " + b; e.YDateTimeStart = new DateTime(2023,4,4).AddDays(myR.Next(50)); e.YDateTime = e.YDateTimeStart.AddDays(myR.Next(50)); s.Elements.Add(e); } SC.Add(s); }
<script runat="server"> Sub Page_Load(ByVal sender As Object, ByVal e As EventArgs) ' Demonstrates range bars with shading effect mode Five. ' Set the title. 'Chart.Title="My Chart";
' Set the chart Type Chart.Type = ChartType.ComboHorizontal
' Turn 3D on. Chart.Use3D = True Chart.ShadingEffectMode = ShadingEffectMode.Five
' Set a default transparency Chart.DefaultElement.Transparency = 30
' Set the x axis label Chart.XAxis.Label.Text="X Axis Label"
' Set the y axis label Chart.YAxis.Label.Text="Y Axis Label"
' Set the x axis scale to time. Chart.XAxis.Scale = Scale.Time
' Set the directory where the images will be stored. Chart.TempDirectory="temp"
' Set the chart size. Chart.Width = 600 Chart.Height = 350
' Add the random data. Chart.SeriesCollection.Add(getRandomData())
End Sub
Function getRandomData() As SeriesCollection Dim SC As SeriesCollection = New SeriesCollection() Dim myR As Random = New Random() For a As Integer = 1 To 4 Dim s As Series = New Series() s.Name = "Series " & a For b As Integer = 1 To 4 Dim e As Element = New Element() e.Name = "Element " & b e.YDateTimeStart = New DateTime(2023,4,4).AddDays(myR.Next(50)) e.YDateTime = e.YDateTimeStart.AddDays(myR.Next(50)) s.Elements.Add(e) Next b SC.Add(s) Next a