Gallery
Post Render Drawing
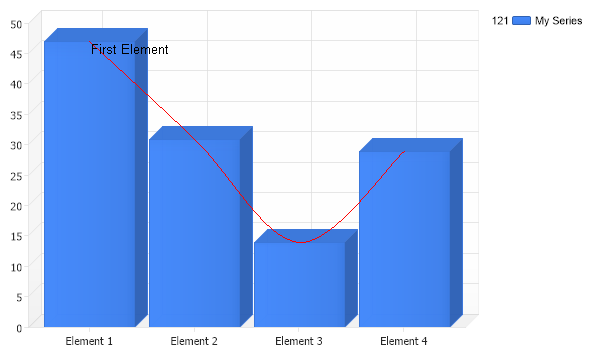
Demonstrates how to modify the chart image programmatically after rendering using GDI+.
- Sample FilenamePostRenderDrawing.aspx
- VersionLegacy (Pre 3.0)
- Uses DatabaseNo