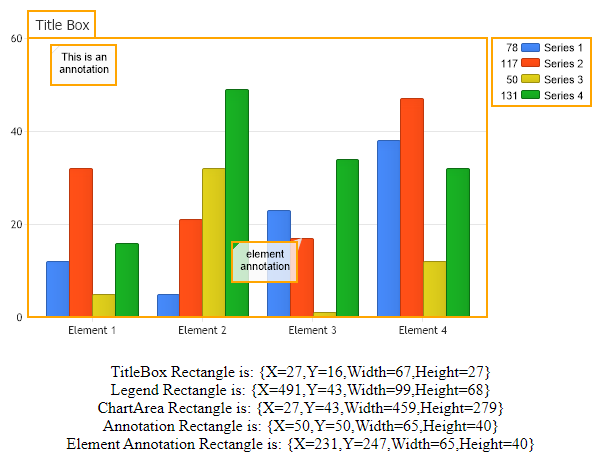
Gallery
Box Coordinates
<%@ Page Language="C#" Description="dotnetCHARTING Component" %>
<%@ Register TagPrefix="dotnet" Namespace="dotnetCHARTING" Assembly="dotnetCHARTING"%>
<%@ Import Namespace="System.Drawing" %>
<%@ Import Namespace="System.Drawing.Drawing2D" %>
<html xmlns="http://www.w3.org/1999/xhtml">
<head>
<title>.netCHARTING Sample</title>
<script runat="server">
void Page_Load(Object sender,EventArgs e)
{
Chart.Type = ChartType.Combo;//Horizontal;
Chart.Size = "600x350";
Chart.TempDirectory = "temp";
Chart.Debug = true;
Chart.Title = "Title Box";
// Demonstrates how the coordinates of boxes on the chart can be acquired after the chart is generated.
// First we setup the data.
// *DYNAMIC DATA NOTE*
// This sample uses random data to populate the chart. To populate
// a chart with database data see the following resources:
// - Classic samples folder
// - Help File > Data Tutorials
// - Sample: features/DataEngine.aspx
SeriesCollection mySC = getRandomData();
// Add the random data.
Chart.SeriesCollection.Add(mySC);
//--------------
// Add an annotation to an element to get its position later.
mySC[1][2].Annotation = new Annotation("element annotation");
// Add an arbirtaty annotation.
Annotation an = new Annotation("This is an annotation");
an.Position = new Point(50,50);
Chart.Annotations.Add(an);
// These two lines will force the chart to generate so the coordinates can be determined.
// We will also get a graphics object we can draw on before we save the final image.
Bitmap bmp = Chart.GetChartBitmap();
Graphics g = Graphics.FromImage(bmp);
// Draw an orange outline around the boxes we get coordinates for.
Pen myPen = new Pen(Color.Orange,2);
g.DrawRectangle(myPen,Chart.TitleBox.GetRectangle());
g.DrawRectangle(myPen,Chart.LegendBox.GetRectangle());
g.DrawRectangle(myPen,Chart.ChartArea.GetRectangle());
g.DrawRectangle(myPen,an.GetRectangle());
g.DrawRectangle(myPen,mySC[1][2].Annotation.GetRectangle());
g.Dispose();
myPen.Dispose();
// Save the final image.
Chart.FileManager.SaveImage(bmp);
// Write the coordinates on the page.
myLabel.Text = "TitleBox Rectangle is: " + Chart.TitleBox.GetRectangle().ToString();
myLabel.Text += "<br>Legend Rectangle is: " + Chart.LegendBox.GetRectangle().ToString();
myLabel.Text += "<br>ChartArea Rectangle is: " + Chart.ChartArea.GetRectangle().ToString();
myLabel.Text += "<br>Annotation Rectangle is: " + an.GetRectangle().ToString();
myLabel.Text += "<br>Element Annotation Rectangle is: " + mySC[1][2].Annotation.GetRectangle().ToString();
}
SeriesCollection getRandomData()
{
SeriesCollection SC = new SeriesCollection();
Random myR = new Random(1);
for(int a = 1; a < 5; a++)
{
Series s = new Series();
s.Name = "Series " + a.ToString();
for(int b = 1; b < 5; b++)
{
Element e = new Element();
e.Name = "Element " + b.ToString();
e.YValue = myR.Next(50);
s.Elements.Add(e);
}
SC.Add(s);
}
return SC;
}
</script>
</head>
<body>
<div style="text-align:center">
<dotnet:Chart id="Chart" runat="server" Width="568px" Height="344px">
</dotnet:Chart>
<br><asp:Label ID="myLabel" Runat=server></asp:Label>
</div>
</body>
</html>
<%@ Page Language="vb" Description="dotnetCHARTING Component" %>
<%@ Register TagPrefix="dotnet" Namespace="dotnetCHARTING" Assembly="dotnetCHARTING"%>
<%@ Import Namespace="System.Drawing" %>
<%@ Import Namespace="System.Drawing.Drawing2D" %>
<html xmlns="http://www.w3.org/1999/xhtml">
<head>
<title>.netCHARTING Sample</title>
<script runat="server">
Sub Page_Load(ByVal sender As Object, ByVal e As EventArgs)
Chart.Type = ChartType.Combo 'Horizontal;
Chart.Size = "600x350"
Chart.TempDirectory = "temp"
Chart.Debug = True
Chart.Title = "Title Box"
' Demonstrates how the coordinates of boxes on the chart can be acquired after the chart is generated.
' First we setup the data.
' *DYNAMIC DATA NOTE*
' This sample uses random data to populate the chart. To populate
' a chart with database data see the following resources:
' - Classic samples folder
' - Help File > Data Tutorials
' - Sample: features/DataEngine.aspx
Dim mySC As SeriesCollection = getRandomData()
' Add the random data.
Chart.SeriesCollection.Add(mySC)
'--------------
' Add an annotation to an element to get its position later.
mySC(1)(2).Annotation = New Annotation("element annotation")
' Add an arbirtaty annotation.
Dim an As Annotation = New Annotation("This is an annotation")
an.Position = New Point(50,50)
Chart.Annotations.Add(an)
' These two lines will force the chart to generate so the coordinates can be determined.
' We will also get a graphics object we can draw on before we save the final image.
Dim bmp As Bitmap = Chart.GetChartBitmap()
Dim g As Graphics = Graphics.FromImage(bmp)
' Draw an orange outline around the boxes we get coordinates for.
Dim myPen As Pen = New Pen(Color.Orange,2)
g.DrawRectangle(myPen,Chart.TitleBox.GetRectangle())
g.DrawRectangle(myPen,Chart.LegendBox.GetRectangle())
g.DrawRectangle(myPen,Chart.ChartArea.GetRectangle())
g.DrawRectangle(myPen,an.GetRectangle())
g.DrawRectangle(myPen,mySC(1)(2).Annotation.GetRectangle())
g.Dispose()
myPen.Dispose()
' Save the final image.
Chart.FileManager.SaveImage(bmp)
' Write the coordinates on the page.
myLabel.Text = "TitleBox Rectangle is: " & Chart.TitleBox.GetRectangle().ToString()
myLabel.Text &= "<br>Legend Rectangle is: " & Chart.LegendBox.GetRectangle().ToString()
myLabel.Text &= "<br>ChartArea Rectangle is: " & Chart.ChartArea.GetRectangle().ToString()
myLabel.Text &= "<br>Annotation Rectangle is: " & an.GetRectangle().ToString()
myLabel.Text &= "<br>Element Annotation Rectangle is: " & mySC(1)(2).Annotation.GetRectangle().ToString()
End Sub
Function getRandomData() As SeriesCollection
Dim SC As SeriesCollection = New SeriesCollection()
Dim myR As Random = New Random(1)
For a As Integer = 1 To 4
Dim s As Series = New Series()
s.Name = "Series " & a.ToString()
For b As Integer = 1 To 4
Dim e As Element = New Element()
e.Name = "Element " & b.ToString()
e.YValue = myR.Next(50)
s.Elements.Add(e)
Next b
SC.Add(s)
Next a
Return SC
End Function
</script>
</head>
<body>
<div style="text-align:center">
<dotnet:Chart id="Chart" runat="server" Width="568px" Height="344px">
</dotnet:Chart>
<br><asp:Label ID="myLabel" Runat=server></asp:Label>
</div>
</body>
</html>
- Sample FilenameBoxCoordinates.aspx
- VersionLegacy (Pre 3.0)
- Uses DatabaseNo