Gallery
Multichart
<%@ Page Language="C#" Description="dotnetCHARTING Component"%>
<%@ Register TagPrefix="dotnet" Namespace="dotnetCHARTING" Assembly="dotnetCHARTING"%>
<%@ Import Namespace="System.Drawing" %>
<script runat="server">
SeriesCollection getRandomData()
{
SeriesCollection SC = new SeriesCollection();
Random myR = new Random();
for(int a = 1; a < 5; a++)
{
Series s = new Series();
s.Name = "Series " + a;
for(int b = 1; b < 8; b++)
{
Element e = new Element();
e.Name = "Element " + b;
e.YValue = myR.Next(50);
s.Elements.Add(e);
}
SC.Add(s);
}
return SC;
}
void Page_Load(Object sender,EventArgs e)
{
//Set Chart 1 properties
Chart1.Title="My Chart 1";
Chart1.Type = ChartType.Combo;
Chart1.DefaultSeries.DefaultElement.Transparency = 35;
Chart1.TempDirectory="temp";
Chart1.Use3D=true;
Chart1.Debug=true;
Chart1.Width = 420;
Chart1.Height = 300;
// Add the random data.
Chart1.SeriesCollection.Add(getRandomData());
//Set Chart 2 properties
Chart2.Title="My Chart 2";
Chart2.Type = ChartType.ComboHorizontal;
Chart2.DefaultSeries.DefaultElement.Transparency = 35;
Chart2.TempDirectory="temp";
Chart2.Use3D=true;
Chart2.Debug=true;
Chart2.Width = 420;
Chart2.Height = 300;
// Add the random data.
Chart2.SeriesCollection.Add(getRandomData());
//Set Chart 3 properties
Chart3.Title="My Chart 3";
Chart3.Type = ChartType.ComboSideBySide;
Chart3.DefaultSeries.DefaultElement.Transparency = 35;
Chart3.TempDirectory="temp";
Chart3.Use3D=true;
Chart3.Debug=true;
Chart3.Width = 420;
Chart3.Height = 300;
// Add the random data.
Chart3.SeriesCollection.Add(getRandomData());
//Set Chart 4 properties
Chart4.Title="My Chart 4";
Chart4.Type = ChartType.Radar;
Chart4.DefaultSeries.DefaultElement.Transparency = 35;
Chart4.RadarLabelMode = RadarLabelMode.Outside;
Chart4.TempDirectory="temp";
Chart4.Use3D=true;
Chart4.Debug=true;
Chart4.Width = 420;
Chart4.Height = 300;
// Add the random data.
Chart4.SeriesCollection.Add(getRandomData());
//Set Chart 5 properties
Chart5.Title="My Chart 5";
Chart5.Type = ChartType.Pies;
Chart5.DefaultSeries.DefaultElement.Transparency = 35;
Chart5.TempDirectory="temp";
Chart5.Use3D=true;
Chart5.Debug=true;
Chart5.Width = 420;
Chart5.Height = 300;
// Add the random data.
Chart5.SeriesCollection.Add(getRandomData());
//Set Chart 6 properties
Chart6.Title="My Chart 6";
Chart6.Type = ChartType.Donut;
Chart6.DefaultSeries.DefaultElement.Transparency = 35;
Chart6.TempDirectory="temp";
Chart6.Use3D=true;
Chart6.Debug=true;
Chart6.Width = 420;
Chart6.Height = 300;
// Add the random data.
Chart6.SeriesCollection.Add(getRandomData());
}
</script>
<html xmlns="http://www.w3.org/1999/xhtml">
<head>
<title>Multi chart sample</title>
</head>
<body style="margin:auto;width:880px;">
<table border="1" cellpadding="0" cellspacing="0" style="border-collapse: collapse" bordercolor="#111111" width="100%" id="AutoNumber1">
<tr>
<td width="50%"> <dotnet:Chart id="Chart1" runat="server"/>
</td>
<td width="50%"> <dotnet:Chart id="Chart2" runat="server"/>
</td>
</tr>
<tr>
<td width="50%"> <dotnet:Chart id="Chart3" runat="server"/></td>
<td width="50%"> <dotnet:Chart id="Chart4" runat="server"/></td>
</tr>
<tr>
<td width="50%"> <dotnet:Chart id="Chart5" runat="server"/></td>
<td width="50%"> <dotnet:Chart id="Chart6" runat="server"/></td>
</tr>
</table>
</body>
</html>
<%@ Page Language="vb" Description="dotnetCHARTING Component"%>
<%@ Register TagPrefix="dotnet" Namespace="dotnetCHARTING" Assembly="dotnetCHARTING"%>
<%@ Import Namespace="System.Drawing" %>
<script runat="server">
Function getRandomData() As SeriesCollection
Dim SC As SeriesCollection = New SeriesCollection()
Dim myR As Random = New Random()
For a As Integer = 1 To 4
Dim s As Series = New Series()
s.Name = "Series " & a
For b As Integer = 1 To 7
Dim e As Element = New Element()
e.Name = "Element " & b
e.YValue = myR.Next(50)
s.Elements.Add(e)
Next b
SC.Add(s)
Next a
Return SC
End Function
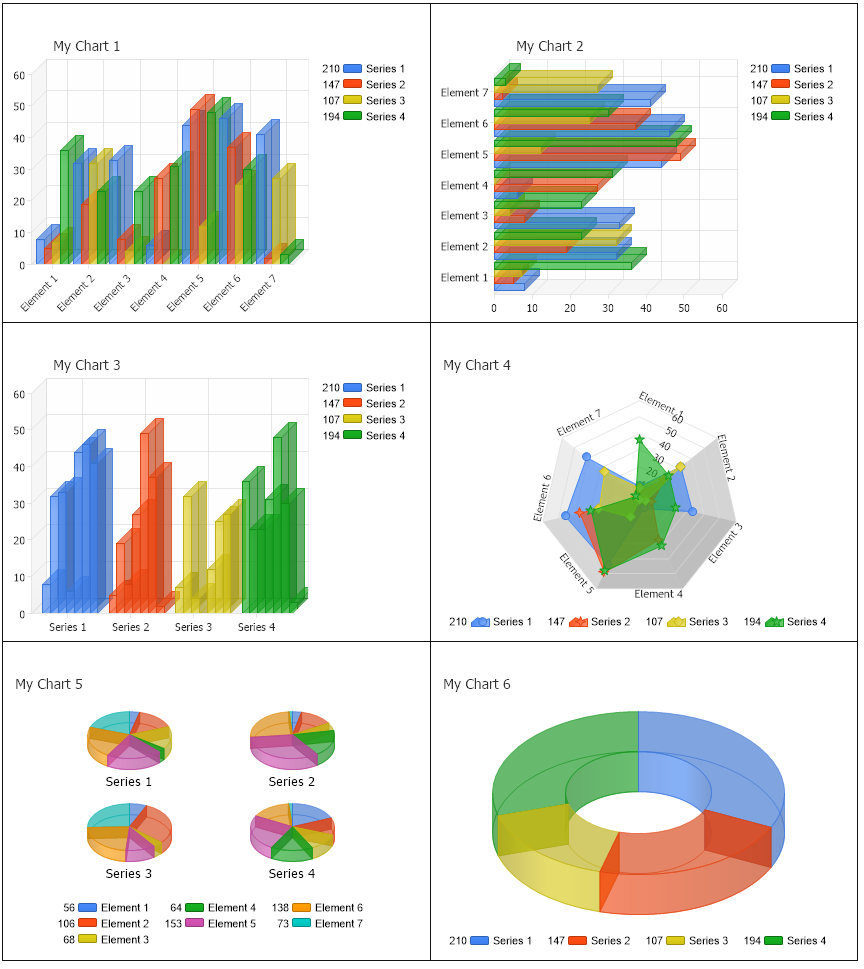
Sub Page_Load(ByVal sender As Object, ByVal e As EventArgs)
'Set Chart 1 properties
Chart1.Title="My Chart 1"
Chart1.Type = ChartType.Combo
Chart1.DefaultSeries.DefaultElement.Transparency = 35
Chart1.TempDirectory="temp"
Chart1.Use3D=True
Chart1.Debug=True
Chart1.Width = 420
Chart1.Height = 300
' Add the random data.
Chart1.SeriesCollection.Add(getRandomData())
'Set Chart 2 properties
Chart2.Title="My Chart 2"
Chart2.Type = ChartType.ComboHorizontal
Chart2.DefaultSeries.DefaultElement.Transparency = 35
Chart2.TempDirectory="temp"
Chart2.Use3D=True
Chart2.Debug=True
Chart2.Width = 420
Chart2.Height = 300
' Add the random data.
Chart2.SeriesCollection.Add(getRandomData())
'Set Chart 3 properties
Chart3.Title="My Chart 3"
Chart3.Type = ChartType.ComboSideBySide
Chart3.DefaultSeries.DefaultElement.Transparency = 35
Chart3.TempDirectory="temp"
Chart3.Use3D=True
Chart3.Debug=True
Chart3.Width = 420
Chart3.Height = 300
' Add the random data.
Chart3.SeriesCollection.Add(getRandomData())
'Set Chart 4 properties
Chart4.Title="My Chart 4"
Chart4.Type = ChartType.Radar
Chart4.DefaultSeries.DefaultElement.Transparency = 35
Chart4.RadarLabelMode = RadarLabelMode.Outside
Chart4.TempDirectory="temp"
Chart4.Use3D=True
Chart4.Debug=True
Chart4.Width = 420
Chart4.Height = 300
' Add the random data.
Chart4.SeriesCollection.Add(getRandomData())
'Set Chart 5 properties
Chart5.Title="My Chart 5"
Chart5.Type = ChartType.Pies
Chart5.DefaultSeries.DefaultElement.Transparency = 35
Chart5.TempDirectory="temp"
Chart5.Use3D=True
Chart5.Debug=True
Chart5.Width = 420
Chart5.Height = 300
' Add the random data.
Chart5.SeriesCollection.Add(getRandomData())
'Set Chart 6 properties
Chart6.Title="My Chart 6"
Chart6.Type = ChartType.Donut
Chart6.DefaultSeries.DefaultElement.Transparency = 35
Chart6.TempDirectory="temp"
Chart6.Use3D=True
Chart6.Debug=True
Chart6.Width = 420
Chart6.Height = 300
' Add the random data.
Chart6.SeriesCollection.Add(getRandomData())
End Sub
</script>
<html xmlns="http://www.w3.org/1999/xhtml">
<head>
<title>Multi chart sample</title>
</head>
<body style="margin:auto;width:880px;">
<table border="1" cellpadding="0" cellspacing="0" style="border-collapse: collapse" bordercolor="#111111" width="100%" id="AutoNumber1">
<tr>
<td width="50%"> <dotnet:Chart id="Chart1" runat="server"/>
</td>
<td width="50%"> <dotnet:Chart id="Chart2" runat="server"/>
</td>
</tr>
<tr>
<td width="50%"> <dotnet:Chart id="Chart3" runat="server"/></td>
<td width="50%"> <dotnet:Chart id="Chart4" runat="server"/></td>
</tr>
<tr>
<td width="50%"> <dotnet:Chart id="Chart5" runat="server"/></td>
<td width="50%"> <dotnet:Chart id="Chart6" runat="server"/></td>
</tr>
</table>
</body>
</html>
- Sample Filenamemultichart.aspx
- VersionLegacy (Pre 3.0)
- Uses DatabaseNo