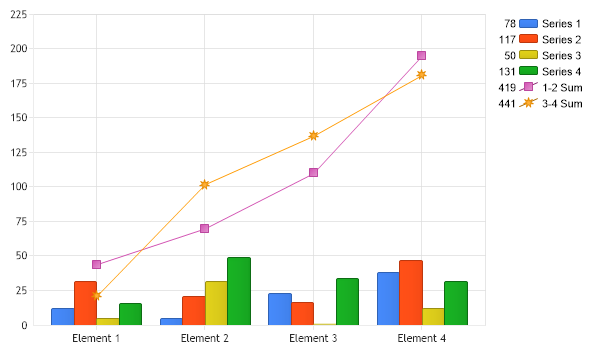
Gallery
Multi-RunningSums
<%@ Page Language="C#" Description="dotnetCHARTING Component" %>
<%@ Register TagPrefix="dotnet" Namespace="dotnetCHARTING" Assembly="dotnetCHARTING" %>
<%@ Import Namespace="System.Drawing" %>
<%@ Import Namespace="System.Drawing.Drawing2D" %>
<%@ Import Namespace="dotnetCHARTING.Mapping" %>
<script runat="server">
void Page_Load(Object sender, EventArgs e)
{
// Demonstrates calculating separate running sums for groups of series.
Chart.TempDirectory = "temp";
Chart.Debug = true;
Chart.Type = ChartType.Combo;
Chart.Size = "600x350";
//Chart.Title = ".netCHARTING Sample";
// *DYNAMIC DATA NOTE*
// This sample uses random data to populate the chart. To populate
// a chart with database data see the following resources:
// - Use the getLiveData() method using the dataEngine to query a database.
// - Help File > Getting Started > Data Tutorials
// - DataEngine Class in the help file
// - Sample: features/DataEngine.aspx
SeriesCollection mySC = getRandomData();
// Make a series collection for each group.
SeriesCollection sc1 = new SeriesCollection(mySC[0], mySC[1]);
SeriesCollection sc2 = new SeriesCollection(mySC[2], mySC[3]);
// Calculate running sums for each group.
Series rSum1 = sc1.Calculate("1-2 Sum", Calculation.RunningSum);
Series rSum2 = sc2.Calculate("3-4 Sum", Calculation.RunningSum);
rSum1.Type = SeriesType.Line;
rSum2.Type = SeriesType.Line;
// Add the groups data.
Chart.SeriesCollection.Add(sc1,sc2);
// Add running sums.
Chart.SeriesCollection.Add(rSum1,rSum2);
}
SeriesCollection getRandomData()
{
Random myR = new Random(1);
SeriesCollection SC = new SeriesCollection();
int a = 0;
int b = 0;
for (a = 1; a < 5; a++)
{
Series s = new Series("Series " + a.ToString());
for (b = 1; b < 5; b++)
{
Element e = new Element("Element " + b.ToString());
e.YValue = myR.Next(50);
s.Elements.Add(e);
}
SC.Add(s);
}
return SC;
}
SeriesCollection getLiveData()
{
DataEngine de = new DataEngine("ConnectionString goes here");
de.ChartObject = Chart; // Necessary to view any errors the dataEngine may throw.
de.SqlStatement = "SELECT XAxisColumn, YAxisColumn FROM ....";
return de.GetSeries();
}
</script>
<html xmlns="http://www.w3.org/1999/xhtml">
<head>
<title>.netCHARTING Sample</title>
</head>
<body>
<div align="center">
<dotnet:Chart ID="Chart" runat="server" />
</div>
</body>
</html>
<%@ Page Language="vb" Description="dotnetCHARTING Component" %>
<%@ Register TagPrefix="dotnet" Namespace="dotnetCHARTING" Assembly="dotnetCHARTING" %>
<%@ Import Namespace="System.Drawing" %>
<%@ Import Namespace="System.Drawing.Drawing2D" %>
<%@ Import Namespace="dotnetCHARTING.Mapping" %>
<script runat="server">
Sub Page_Load(ByVal sender As Object, ByVal e As EventArgs)
' Demonstrates calculating separate running sums for groups of series.
Chart.TempDirectory = "temp"
Chart.Debug = True
Chart.Type = ChartType.Combo
Chart.Size = "600x350"
'Chart.Title = ".netCHARTING Sample";
' *DYNAMIC DATA NOTE*
' This sample uses random data to populate the chart. To populate
' a chart with database data see the following resources:
' - Use the getLiveData() method using the dataEngine to query a database.
' - Help File > Getting Started > Data Tutorials
' - DataEngine Class in the help file
' - Sample: features/DataEngine.aspx
Dim mySC As SeriesCollection = getRandomData()
' Make a series collection for each group.
Dim sc1 As SeriesCollection = New SeriesCollection(mySC(0), mySC(1))
Dim sc2 As SeriesCollection = New SeriesCollection(mySC(2), mySC(3))
' Calculate running sums for each group.
Dim rSum1 As Series = sc1.Calculate("1-2 Sum", Calculation.RunningSum)
Dim rSum2 As Series = sc2.Calculate("3-4 Sum", Calculation.RunningSum)
rSum1.Type = SeriesType.Line
rSum2.Type = SeriesType.Line
' Add the groups data.
Chart.SeriesCollection.Add(sc1,sc2)
' Add running sums.
Chart.SeriesCollection.Add(rSum1,rSum2)
End Sub
Function getRandomData() As SeriesCollection
Dim myR As Random = New Random(1)
Dim SC As SeriesCollection = New SeriesCollection()
Dim a As Integer = 0
Dim b As Integer = 0
For a = 1 To 4
Dim s As Series = New Series("Series " & a.ToString())
For b = 1 To 4
Dim e As Element = New Element("Element " & b.ToString())
e.YValue = myR.Next(50)
s.Elements.Add(e)
Next b
SC.Add(s)
Next a
Return SC
End Function
Function getLiveData() As SeriesCollection
Dim de As DataEngine = New DataEngine("ConnectionString goes here")
de.ChartObject = Chart ' Necessary to view any errors the dataEngine may throw.
de.SqlStatement = "SELECT XAxisColumn, YAxisColumn FROM ...."
Return de.GetSeries()
End Function
</script>
<html xmlns="http://www.w3.org/1999/xhtml">
<head>
<title>.netCHARTING Sample</title>
</head>
<body>
<div align="center">
<dotnet:Chart ID="Chart" runat="server" />
</div>
</body>
</html>
- Sample FilenameMulti-RunningSums.aspx
- Version5.0
- Uses DatabaseNo