Chart.ObjectChart = new dotnetCHARTING.Label(getStr());
}
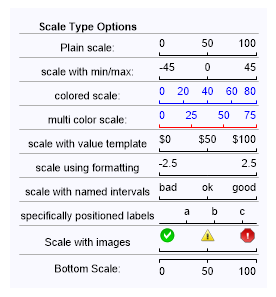
string getStr() { string s = "<block fStyle='Bold'>Scale Type Options<block><hr>";
// A maximum value must be set to get a basic micro scale. s += "Plain scale: <chart:scale max='100'>";
// positive and negative values can be used with micro scale ranges. s += "<hr>scale with min/max: <chart:scale min='-45' max='45'>";
// scales can be colored using a single color or two colors to shade the axis and labels individually. s += "<hr>colored scale: <chart:scale max='80' color='blue'>"; s += "<hr>multi color scale: <chart:scale max='75' colors='blue,red'>";
// the value parameter can be used with tokens similar to using chart.xaxis.defaulttick.label.text enabling many possibilities. s += "<hr>scale with value template <chart:scale max='100' value='$%value'>";
s += "<hr>scale using formatting <chart:scale min='-2.5' max='2.5' value='<%value,###.#>'>";
// by specifying an array of labels in the values parameter they are placed on the scale equidistant from each other. s += "<hr>scale with named intervals <chart:scale values='bad,ok,good'>";//height='25'
// inserting comma delimiters into the values parameter allows control over named label positions. s += "<hr>specifically positioned labels <chart:scale values=',,a,,b,,c,'>";
s += "<hr>Scale with images<Chart:Scale values='<img:../../../images/error0.png>,<img:../../../images/error.png>,<img:../../../images/error2.png>' height='25'>";
s += "<hr>Bottom Scale: <Chart:ScaleB max='100'>";
Chart.ObjectChart = New dotnetCHARTING.Label(getStr())
End Sub
Function getStr() As String Dim s As String = "<block fStyle='Bold'>Scale Type Options<block><hr>"
' A maximum value must be set to get a basic micro scale. s &= "Plain scale: <chart:scale max='100'>"
' positive and negative values can be used with micro scale ranges. s &= "<hr>scale with min/max: <chart:scale min='-45' max='45'>"
' scales can be colored using a single color or two colors to shade the axis and labels individually. s &= "<hr>colored scale: <chart:scale max='80' color='blue'>" s &= "<hr>multi color scale: <chart:scale max='75' colors='blue,red'>"
' the value parameter can be used with tokens similar to using chart.xaxis.defaulttick.label.text enabling many possibilities. s &= "<hr>scale with value template <chart:scale max='100' value='$%value'>"
s &= "<hr>scale using formatting <chart:scale min='-2.5' max='2.5' value='<%value,###.#>'>"
' by specifying an array of labels in the values parameter they are placed on the scale equidistant from each other. s &= "<hr>scale with named intervals <chart:scale values='bad,ok,good'>" 'height='25'
' inserting comma delimiters into the values parameter allows control over named label positions. s &= "<hr>specifically positioned labels <chart:scale values=',,a,,b,,c,'>"
s &= "<hr>Scale with images<Chart:Scale values='<img:../../../images/error0.png>,<img:../../../images/error.png>,<img:../../../images/error2.png>' height='25'>"