Scale Chart Combos
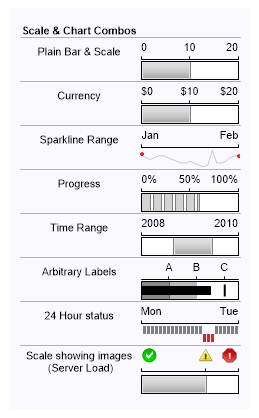
Demonstrates several ways MicroChart scales can be used with other micro charts.
<%@ Page Language="C#" Description="dotnetCHARTING Component" %>
<%@ Register TagPrefix="dotnet" Namespace="dotnetCHARTING" Assembly="dotnetCHARTING" %>
<%@ Import Namespace="System.Drawing" %>
<script runat="server">
void Page_Load(Object sender, EventArgs e)
{
// Demonstrates several ways MicroChart scales can be used with other micro charts.
Chart.TempDirectory = "temp";
Chart.Background.Color = Color.FromArgb(249,249,255);
Chart.Size = "300x400";
Chart.Margin = "10";
Chart.Debug = true;
string s = "<block fStyle='Bold'>Scale & Chart Combos<block><hr>";
// A scale/Bar micro chart combo will require that the scale and bar maximum values are set equally.
s += "Plain Bar & Scale <Chart:Scale max='20' >";
s += "<row><block><Chart:Bar value='10' max='20' shading='7'><hr>";
// Similar situation where the scale labels show a $ char before the value.
s += "Currency <Chart:Scale max='20' value='$%Value'>";
s += "<row><block><Chart:Bar value='10' max='20' shading='7'><hr>";
// Using a scale to indicate a time span represented by a sparkline.
s += "Sparkline Range <Chart:Scale values='Jan,Feb'>";
s += "<row><block><Chart:SparkLine values='10,8,7,8,9,9,8,7,6,5,5,6,5,4,3,4,12,5,5,6,8,9,9' colors='Gray,Red'><hr>";
// A progress bar and scale showing percent complete.
s += "Progress <Chart:Scale max='100' value='%Value%'>";
s += "<row><block><Chart:Progress value='60' max='100'><hr>";
// This case is similar to the sparkline time range but a bar is used to indicate a range. The range shown is created by manipulating the bar scale min/max values.
s += "Time Range <Chart:Scale values='2008,2010'>";
s += "<row><block><Chart:Bar value='60' min='-50' max='100' shading='7'><hr>";
// A scale with labels placed at specific positions to mark specific positions.
s += "Arbitrary Labels <Chart:Scale values=',,A,,B,,C,'>";
s += "<row><block><Chart:Bullet values='50,60,20,40' min='0' max='70'><hr>";
s += "24 Hour status <Chart:Scale values='Mon,Tue' width='100'>";
s += "<row><block><Chart:WinLose values='1,1,1,1,1,1,1,1,1,1,1,1,1,1,1,-1,-1,-1,1,1,1,1,1,1' width='100' colors='Gray'><hr>";
s += "Scale showing images<br> (Server Load) <Chart:Scale values='<img:../../../images/error0.png>,,<img:../../../images/error.png>,<img:../../../images/error2.png>' height='25'>";
s += "<row><block><Chart:Bar value='50' width='100' shading='7'>";
Chart.ObjectChart = new dotnetCHARTING.Label(s);
}
</script>
<html xmlns="http://www.w3.org/1999/xhtml">
<head>
<title>.netCHARTING Sample</title>
</head>
<body>
<div align="center">
<dotnet:Chart ID="Chart" runat="server" />
</div>
</body>
</html>
<%@ Page Language="vb" Description="dotnetCHARTING Component" %>
<%@ Register TagPrefix="dotnet" Namespace="dotnetCHARTING" Assembly="dotnetCHARTING" %>
<%@ Import Namespace="System.Drawing" %>
<script runat="server">
Sub Page_Load(ByVal sender As Object, ByVal e As EventArgs)
' Demonstrates several ways MicroChart scales can be used with other micro charts.
Chart.TempDirectory = "temp"
Chart.Background.Color = Color.FromArgb(249,249,255)
Chart.Size = "300x400"
Chart.Margin = "10"
Chart.Debug = True
Dim s As String = "<block fStyle='Bold'>Scale & Chart Combos<block><hr>"
' A scale/Bar micro chart combo will require that the scale and bar maximum values are set equally.
s &= "Plain Bar & Scale <Chart:Scale max='20' >"
s &= "<row><block><Chart:Bar value='10' max='20' shading='7'><hr>"
' Similar situation where the scale labels show a $ char before the value.
s &= "Currency <Chart:Scale max='20' value='$%Value'>"
s &= "<row><block><Chart:Bar value='10' max='20' shading='7'><hr>"
' Using a scale to indicate a time span represented by a sparkline.
s &= "Sparkline Range <Chart:Scale values='Jan,Feb'>"
s &= "<row><block><Chart:SparkLine values='10,8,7,8,9,9,8,7,6,5,5,6,5,4,3,4,12,5,5,6,8,9,9' colors='Gray,Red'><hr>"
' A progress bar and scale showing percent complete.
s &= "Progress <Chart:Scale max='100' value='%Value%'>"
s &= "<row><block><Chart:Progress value='60' max='100'><hr>"
' This case is similar to the sparkline time range but a bar is used to indicate a range. The range shown is created by manipulating the bar scale min/max values.
s &= "Time Range <Chart:Scale values='2008,2010'>"
s &= "<row><block><Chart:Bar value='60' min='-50' max='100' shading='7'><hr>"
' A scale with labels placed at specific positions to mark specific positions.
s &= "Arbitrary Labels <Chart:Scale values=',,A,,B,,C,'>"
s &= "<row><block><Chart:Bullet values='50,60,20,40' min='0' max='70'><hr>"
s &= "24 Hour status <Chart:Scale values='Mon,Tue' width='100'>"
s &= "<row><block><Chart:WinLose values='1,1,1,1,1,1,1,1,1,1,1,1,1,1,1,-1,-1,-1,1,1,1,1,1,1' width='100' colors='Gray'><hr>"
s &= "Scale showing images<br> (Server Load) <Chart:Scale values='<img:../../../images/error0.png>,,<img:../../../images/error.png>,<img:../../../images/error2.png>' height='25'>"
s &= "<row><block><Chart:Bar value='50' width='100' shading='7'>"
Chart.ObjectChart = New dotnetCHARTING.Label(s)
End Sub
</script>
<html xmlns="http://www.w3.org/1999/xhtml">
<head>
<title>.netCHARTING Sample</title>
</head>
<body>
<div align="center">
<dotnet:Chart ID="Chart" runat="server" />
</div>
</body>
</html>