Gallery
Legend Charts
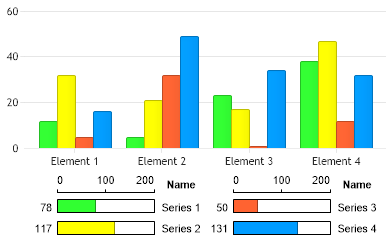
Demonstrates adding a bullet microChart into a legend box value column and use a scale MicroChart for the column head.
- Sample FilenameLegendCharts.aspx
- Version5.2
- Uses DatabaseNo