// Use absolute positioning for the legend box. Chart.LegendBox.Position = new Point(40, 40);
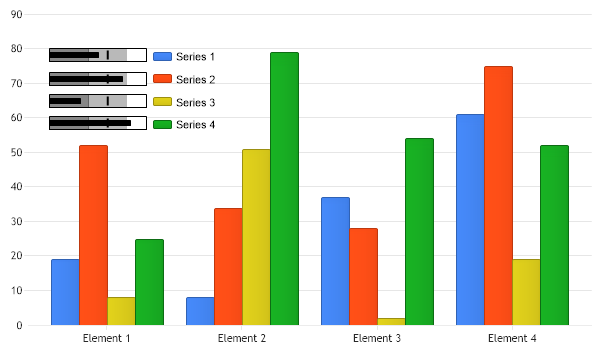
// This line will replace the default %YSum token with a microchart that displays it. Chart.LegendBox.DefaultEntry.Value = "<Chart:Bullet height='15' values='%YSum,150,100,200' max='250'>";
// Add the random data. Chart.SeriesCollection.Add(getRandomData()); }
SeriesCollection getRandomData() { Random myR = new Random(1); SeriesCollection SC = new SeriesCollection(); for (int a = 1; a < 5; a++) { Series s = new Series("Series " + a.ToString()); for (int b = 1; b < 5; b++) { Element e = new Element("Element " + b.ToString()); e.YValue = myR.Next(80); s.Elements.Add(e); } SC.Add(s); } return SC; }
SeriesCollection getLiveData() { DataEngine de = new DataEngine("ConnectionString goes here"); de.ChartObject = Chart; // Necessary to view any errors the dataEngine may throw. de.SqlStatement = "SELECT XAxisColumn, YAxisColumn FROM ...."; return de.GetSeries(); }
' Use absolute positioning for the legend box. Chart.LegendBox.Position = New Point(40, 40)
' This line will replace the default %YSum token with a microchart that displays it. Chart.LegendBox.DefaultEntry.Value = "<Chart:Bullet height='15' values='%YSum,150,100,200' max='250'>"
' Add the random data. Chart.SeriesCollection.Add(getRandomData()) End Sub
Function getRandomData() As SeriesCollection Dim myR As Random = New Random(1) Dim SC As SeriesCollection = New SeriesCollection() For a As Integer = 1 To 4 Dim s As Series = New Series("Series " & a.ToString()) For b As Integer = 1 To 4 Dim e As Element = New Element("Element " & b.ToString()) e.YValue = myR.Next(80) s.Elements.Add(e) Next b SC.Add(s) Next a Return SC End Function
Function getLiveData() As SeriesCollection Dim de As DataEngine = New DataEngine("ConnectionString goes here") de.ChartObject = Chart ' Necessary to view any errors the dataEngine may throw. de.SqlStatement = "SELECT XAxisColumn, YAxisColumn FROM ...." Return de.GetSeries() End Function