Gallery
<%@ Page Language="C#" Description="dotnetCHARTING Component"%>
<%@ Register TagPrefix="dotnet" Namespace="dotnetCHARTING" Assembly="dotnetCHARTING"%>
<%@ Import Namespace="System.Drawing" %>
<script runat="server">
void Page_Load(Object sender,EventArgs e)
{
//set global properties
Chart.Title ="Orders By Customers";
Chart.DefaultSeries.ConnectionString = ConfigurationManager.AppSettings["DNCConnectionString"];
Chart.XAxis.Label.Text="Customers";
Chart.TempDirectory="temp";
Chart.Debug=true;
Chart.Use3D=true;
//Set TitleBox
Chart.LegendBox.Background = new Background(System.Drawing.Color.SkyBlue);
Chart.LegendBox.CornerBottomLeft = BoxCorner.Square;
Chart.LegendBox.CornerBottomRight = BoxCorner.Square;
Chart.LegendBox.CornerTopLeft = BoxCorner.Square;
Chart.LegendBox.CornerTopRight = BoxCorner.Cut;
Chart.LegendBox.LabelStyle = new dotnetCHARTING.Label("",new Font("Arial",10),Color.DarkSlateBlue);
Chart.LegendBox.Line = new Line(Color.Blue);
Chart.LegendBox.Position = LegendBoxPosition.Top;
//Chart.LegendBox.Shadow.Color = Color.LightBlue;
//Chart.LegendBox.Shadow.Depth=5;
//Add a series
Chart.Series.Name="Orders";
Chart.Series.SqlStatement= @"SELECT Name,Sum(1) FROM Orders GROUP BY Name ORDER BY Sum(1) DESC";
Chart.SeriesCollection.Add();
}
</script>
<html xmlns="http://www.w3.org/1999/xhtml">
<head>
<title>Orders Report</title>
</head>
<body>
<div style="text-align:center">
<dotnet:Chart id="Chart" runat="server"/>
</div>
</body>
</html>
<%@ Page Language="vb" Description="dotnetCHARTING Component"%>
<%@ Register TagPrefix="dotnet" Namespace="dotnetCHARTING" Assembly="dotnetCHARTING"%>
<%@ Import Namespace="System.Drawing" %>
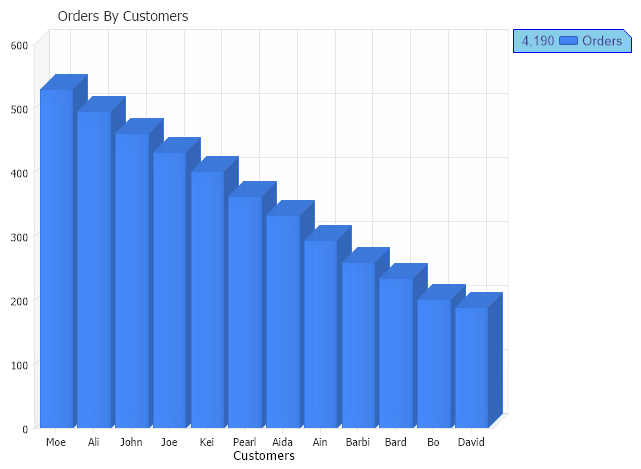
<script runat="server">
Sub Page_Load(ByVal sender As Object, ByVal e As EventArgs)
'set global properties
Chart.Title ="Orders By Customers"
Chart.DefaultSeries.ConnectionString = ConfigurationManager.AppSettings("DNCConnectionString")
Chart.XAxis.Label.Text="Customers"
Chart.TempDirectory="temp"
Chart.Debug=True
Chart.Use3D=True
'Set TitleBox
Chart.LegendBox.Background = New Background(System.Drawing.Color.SkyBlue)
Chart.LegendBox.CornerBottomLeft = BoxCorner.Square
Chart.LegendBox.CornerBottomRight = BoxCorner.Square
Chart.LegendBox.CornerTopLeft = BoxCorner.Square
Chart.LegendBox.CornerTopRight = BoxCorner.Cut
Chart.LegendBox.LabelStyle = New dotnetCHARTING.Label("",New Font("Arial",10),Color.DarkSlateBlue)
Chart.LegendBox.Line = New Line(Color.Blue)
Chart.LegendBox.Position = LegendBoxPosition.Top
'Chart.LegendBox.Shadow.Color = Color.LightBlue;
'Chart.LegendBox.Shadow.Depth=5;
'Add a series
Chart.Series.Name="Orders"
Chart.Series.SqlStatement= "SELECT Name,Sum(1) FROM Orders GROUP BY Name ORDER BY Sum(1) DESC"
Chart.SeriesCollection.Add()
End Sub
</script>
<html xmlns="http://www.w3.org/1999/xhtml">
<head>
<title>Orders Report</title>
</head>
<body>
<div style="text-align:center">
<dotnet:Chart id="Chart" runat="server"/>
</div>
</body>
</html>
- Sample FilenameLegendBox.aspx
- VersionLegacy (Pre 3.0)
- Uses DatabaseYes