// Demonstrates how to use absolute positioning with a legend box.
// We'll give the legend some transparency since we may need to see what's going on underneath. Chart.LegendBox.Background.Color = Color.FromArgb(180, 236, 236, 236); // We'll also get rid of the shadow. Chart.LegendBox.Shadow.Color = Color.Empty;
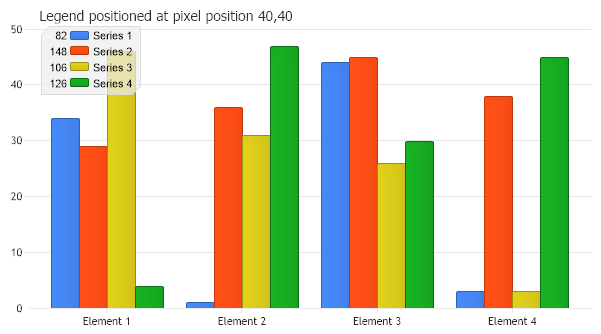
// To set an absolute position we specify a Point object for the legend boxes position property. Chart.LegendBox.Position = new Point(40,40);
// *DYNAMIC DATA NOTE* // This sample uses random data to populate the chart. To populate // a chart with database data see the following resources: // - Classic samples folder // - Help File > Data Tutorials // - Sample: features/DataEngine.aspx Chart.SeriesCollection.Add(getRandomData());
}
SeriesCollection getRandomData() { SeriesCollection SC = new SeriesCollection(); Random myR = new Random(); for(int a = 1; a < 5; a++) { Series s = new Series(); s.Name = "Series " + a; for(int b = 1; b < 5; b++) { Element e = new Element(); e.Name = "Element " + b; //e.YValue = -25 + myR.Next(50); e.YValue = myR.Next(50); s.Elements.Add(e); } SC.Add(s); }
' Demonstrates how to use absolute positioning with a legend box.
' We'll give the legend some transparency since we may need to see what's going on underneath. Chart.LegendBox.Background.Color = Color.FromArgb(180, 236, 236, 236) ' We'll also get rid of the shadow. Chart.LegendBox.Shadow.Color = Color.Empty
' To set an absolute position we specify a Point object for the legend boxes position property. Chart.LegendBox.Position = New Point(40,40)
' *DYNAMIC DATA NOTE* ' This sample uses random data to populate the chart. To populate ' a chart with database data see the following resources: ' - Classic samples folder ' - Help File > Data Tutorials ' - Sample: features/DataEngine.aspx Chart.SeriesCollection.Add(getRandomData())
End Sub
Function getRandomData() As SeriesCollection Dim SC As SeriesCollection = New SeriesCollection() Dim myR As Random = New Random() For a As Integer = 1 To 4 Dim s As Series = New Series() s.Name = "Series " & a For b As Integer = 1 To 4 Dim e As Element = New Element() e.Name = "Element " & b 'e.YValue = -25 + myR.Next(50); e.YValue = myR.Next(50) s.Elements.Add(e) Next b SC.Add(s) Next a
Return SC End Function </script> </head> <body> <div style="text-align:center"> <dotnet:Chart id="Chart" runat="server" Width="568px" Height="344px"> </dotnet:Chart> </div> </body> </html>