Chart.Type = ChartType.Combo;//Horizontal; Chart.Width = 900; Chart.Height = 350; Chart.TempDirectory = "temp"; Chart.Debug = true; //Chart.DefaultBox.ClearColors(); //Chart.DefaultChartArea.LegendBox.ClearColors(); // Demonstrates how to populate custom legend boxes automatically with series data.
// *DYNAMIC DATA NOTE* // This sample uses random data to populate the chart. To populate // a chart with database data see the following resources: // - Classic samples folder // - Help File > Data Tutorials // - Sample: features/DataEngine.aspx SeriesCollection mySC = getRandomData();
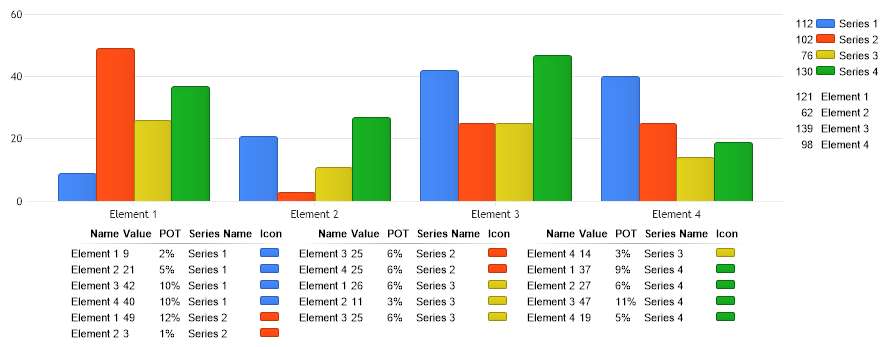
// Instantiate a legend box. LegendBox lb = new LegendBox();
// Create a data source from the mySC series collection and specify the splitInto parameter. DataSource tds = DataSource.FromSeriesCollection(mySC,DataSourceType.ElementGroup); // This datasource states that we want to series collection split into element groups which means elements // with the same name.
// Set the source fr the legend box and add the legend to the chart. lb.DataSource = tds; Chart.ExtraLegendBoxes.Add(lb);
// Now we'll make a legend box where we'll split the series into individual elements. LegendBox lb2 = new LegendBox(); // The second data source we'll create in a different way. Unit the above method it would look like this: // DataSource tds2 = DataSource.FromSeriesCollection(mySC,DataSourceType.Element); // This is a simpler way of specifying a series collection as the source. DataSource tds2 = mySC; // But now we must also specify the split into property tds2.SplitInto = DataSourceType.Element;
//We'll show some more info about each element so we setup the columns for the legend box. lb2.Template = "%Name %YValue %PercentOfTotal %SeriesName %Icon"; // Notice we wont be adding attributes for each of these columns. That's because if you use tokens in the column // template that pertain to the type the entries represent, they will automatically show the correct info.
//We'll also orient the legend box so it's on the bottom of the chart. lb2.Orientation = dotnetCHARTING.Orientation.Bottom;
// Set the data source and add it. lb2.DataSource = tds2; Chart.ExtraLegendBoxes.Add(lb2);
// Setup a header of the second legend box. (See LegendBoxCustomHeader.aspx for more info) LegendEntry header2 = new LegendEntry("Name","","Icon"); header2.SortOrder = -1; header2.DividerLine.Color = Color.DarkGray; header2.LabelStyle.Font = new Font("Arial",8,FontStyle.Bold); header2.CustomAttributes.Add("YValue", "Value"); header2.CustomAttributes.Add("SeriesName", "Series Name"); header2.CustomAttributes.Add("PercentOfTotal", "POT"); header2.HeaderMode = LegendEntryHeaderMode.RepeatOnEachColumn;
// Add the header. lb2.ExtraEntries.Add(header2);
// Add the random data. Chart.SeriesCollection.Add(mySC);
}
SeriesCollection getRandomData() { SeriesCollection SC = new SeriesCollection(); Random myR = new Random(); for(int a = 1; a < 5; a++) { Series s = new Series(); s.Name = "Series " + a; for(int b = 1; b < 5; b++) { Element e = new Element(); e.Name = "Element " + b; //e.YValue = -25 + myR.Next(50); e.YValue = myR.Next(50); s.Elements.Add(e); } SC.Add(s); }
Sub Page_Load(ByVal sender As Object, ByVal e As EventArgs)
Chart.Type = ChartType.Combo 'Horizontal; Chart.Width = 900 Chart.Height = 350 Chart.TempDirectory = "temp" Chart.Debug = True 'Chart.DefaultBox.ClearColors(); 'Chart.DefaultChartArea.LegendBox.ClearColors(); ' Demonstrates how to populate custom legend boxes automatically with series data.
' *DYNAMIC DATA NOTE* ' This sample uses random data to populate the chart. To populate ' a chart with database data see the following resources: ' - Classic samples folder ' - Help File > Data Tutorials ' - Sample: features/DataEngine.aspx Dim mySC As SeriesCollection = getRandomData()
' Instantiate a legend box. Dim lb As LegendBox = New LegendBox()
' Create a data source from the mySC series collection and specify the splitInto parameter. Dim tds As DataSource = DataSource.FromSeriesCollection(mySC,DataSourceType.ElementGroup) ' This datasource states that we want to series collection split into element groups which means elements ' with the same name.
' Set the source fr the legend box and add the legend to the chart. lb.DataSource = tds Chart.ExtraLegendBoxes.Add(lb)
' Now we'll make a legend box where we'll split the series into individual elements. Dim lb2 As LegendBox = New LegendBox() ' The second data source we'll create in a different way. Unit the above method it would look like this: ' DataSource tds2 = DataSource.FromSeriesCollection(mySC,DataSourceType.Element); ' This is a simpler way of specifying a series collection as the source. Dim tds2 As DataSource = mySC ' But now we must also specify the split into property tds2.SplitInto = DataSourceType.Element
'We'll show some more info about each element so we setup the columns for the legend box. lb2.Template = "%Name %YValue %PercentOfTotal %SeriesName %Icon" ' Notice we wont be adding attributes for each of these columns. That's because if you use tokens in the column ' template that pertain to the type the entries represent, they will automatically show the correct info.
'We'll also orient the legend box so it's on the bottom of the chart. lb2.Orientation = dotnetCHARTING.Orientation.Bottom
' Set the data source and add it. lb2.DataSource = tds2 Chart.ExtraLegendBoxes.Add(lb2)
' Setup a header of the second legend box. (See LegendBoxCustomHeader.aspx for more info) Dim header2 As LegendEntry = New LegendEntry("Name","","Icon") header2.SortOrder = -1 header2.DividerLine.Color = Color.DarkGray header2.LabelStyle.Font = New Font("Arial",8,FontStyle.Bold) header2.CustomAttributes.Add("YValue", "Value") header2.CustomAttributes.Add("SeriesName", "Series Name") header2.CustomAttributes.Add("PercentOfTotal", "POT") header2.HeaderMode = LegendEntryHeaderMode.RepeatOnEachColumn
' Add the header. lb2.ExtraEntries.Add(header2)
' Add the random data. Chart.SeriesCollection.Add(mySC)
End Sub
Function getRandomData() As SeriesCollection Dim SC As SeriesCollection = New SeriesCollection() Dim myR As Random = New Random() For a As Integer = 1 To 4 Dim s As Series = New Series() s.Name = "Series " & a For b As Integer = 1 To 4 Dim e As Element = New Element() e.Name = "Element " & b 'e.YValue = -25 + myR.Next(50); e.YValue = myR.Next(50) s.Elements.Add(e) Next b SC.Add(s) Next a
Return SC End Function </script> </head> <body> <div style="text-align:center"> <dotnet:Chart id="Chart" runat="server" Width="568px" Height="344px"> </dotnet:Chart> </div> </body> </html>