// *DYNAMIC DATA NOTE* // This sample uses random data to populate the chart. To populate // a chart with database data see the following resources: // - Classic samples folder // - Help File > Data Tutorials // - Sample: features/DataEngine.aspx SeriesCollection mySC = getRandomData();
// Add the random data. Chart.SeriesCollection.Add(mySC);
}
SeriesCollection getRandomData() { SeriesCollection SC = new SeriesCollection(); Random myR = new Random(1); for(int a = 1; a < 5; a++) { Series s = new Series(); s.Name = "Series " + a.ToString(); for(int b = 1; b < 5; b++) { Element e = new Element(); e.Name = "Element " + b.ToString(); e.YValue = myR.Next(50); s.Elements.Add(e); } SC.Add(s); }
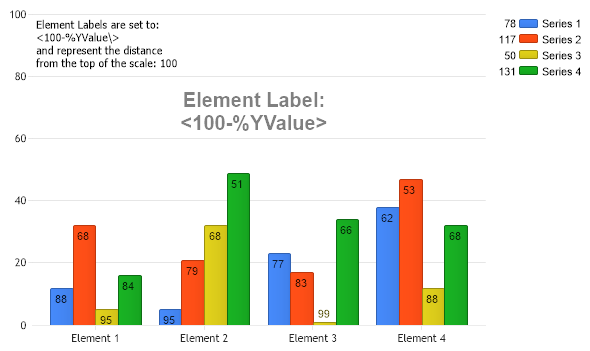
Dim an As Annotation = New Annotation("Element Label: <100-%YValue>") an.ClearColors() an.Label.Color = Color.Gray an.Label.Font = New Font("Arial",15,FontStyle.Bold) an.Position = New Point(170,80) Chart.Annotations.Add(an) ' Demonstrates ....
Chart.ChartArea.Label.Text = "Element Labels are set to:" & Constants.vbLf & "\<100-\%YValue\> " & Constants.vbLf & "and represent the distance " & Constants.vbLf & "from the top of the scale: 100"
' *DYNAMIC DATA NOTE* ' This sample uses random data to populate the chart. To populate ' a chart with database data see the following resources: ' - Classic samples folder ' - Help File > Data Tutorials ' - Sample: features/DataEngine.aspx Dim mySC As SeriesCollection = getRandomData()
' Add the random data. Chart.SeriesCollection.Add(mySC)
End Sub
Function getRandomData() As SeriesCollection Dim SC As SeriesCollection = New SeriesCollection() Dim myR As Random = New Random(1) For a As Integer = 1 To 4 Dim s As Series = New Series() s.Name = "Series " & a.ToString() For b As Integer = 1 To 4 Dim e As Element = New Element() e.Name = "Element " & b.ToString() e.YValue = myR.Next(50) s.Elements.Add(e) Next b SC.Add(s) Next a
Return SC End Function </script> </head> <body> <div style="text-align:center"> <dotnet:Chart id="Chart" runat="server" Width="568px" Height="344px"> </dotnet:Chart> </div> </body> </html>