// *DYNAMIC DATA NOTE* // This sample uses random data to populate the chart. To populate // a chart with database data see the following resources: // - Classic samples folder // - Help File > Data Tutorials // - Sample: features/DataEngine.aspx SeriesCollection mySC = getRandomData();
// Clear the secondary alignment options of element labels. foreach(Series ser in mySC) { ser.DefaultElement.SmartLabel.AlignmentSecondary.Clear(); foreach(Element el in ser.Elements) { el.SmartLabel.AlignmentSecondary.Clear(); } }
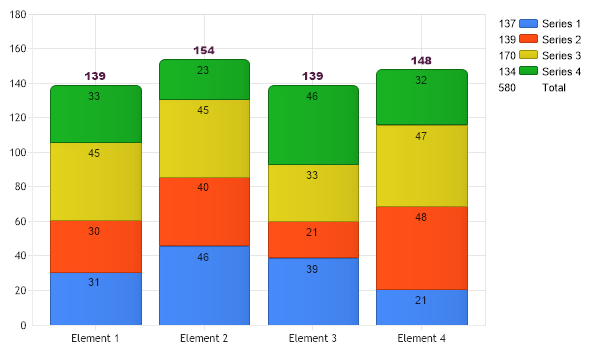
// Create a total series that is invisible. Just used to place the totals labels. Series total = mySC.Calculate("Total",Calculation.Sum); total.Type = SeriesType.Marker;
// Add the random data. Chart.SeriesCollection.Add(mySC); Chart.SeriesCollection.Add(total);
}
SeriesCollection getRandomData() { SeriesCollection SC = new SeriesCollection(); Random myR = new Random(7); for(int a = 1; a < 5; a++) { Series s = new Series(); s.Name = "Series " + a.ToString(); for(int b = 1; b < 5; b++) { Element e = new Element(); e.Name = "Element " + b.ToString(); e.YValue = myR.Next(20,50); s.Elements.Add(e); } SC.Add(s); }
' *DYNAMIC DATA NOTE* ' This sample uses random data to populate the chart. To populate ' a chart with database data see the following resources: ' - Classic samples folder ' - Help File > Data Tutorials ' - Sample: features/DataEngine.aspx Dim mySC As SeriesCollection = getRandomData()
' Clear the secondary alignment options of element labels. For Each ser As Series In mySC ser.DefaultElement.SmartLabel.AlignmentSecondary.Clear() For Each el As Element In ser.Elements el.SmartLabel.AlignmentSecondary.Clear() Next el Next ser
' Create a total series that is invisible. Just used to place the totals labels. Dim total As Series = mySC.Calculate("Total",Calculation.Sum) total.Type = SeriesType.Marker
' Add the random data. Chart.SeriesCollection.Add(mySC) Chart.SeriesCollection.Add(total)
End Sub
Function getRandomData() As SeriesCollection Dim SC As SeriesCollection = New SeriesCollection() Dim myR As Random = New Random(7) For a As Integer = 1 To 4 Dim s As Series = New Series() s.Name = "Series " & a.ToString() For b As Integer = 1 To 4 Dim e As Element = New Element() e.Name = "Element " & b.ToString() e.YValue = myR.Next(20,50) s.Elements.Add(e) Next b SC.Add(s) Next a
Return SC End Function </script> </head> <body> <div style="text-align:center"> <dotnet:Chart id="Chart" runat="server" Width="568px" Height="344px"> </dotnet:Chart> </div> </body> </html>