Annotation a = mySC[0][0].Annotation = new Annotation(); a.DynamicSize = false; a.Label.Text = "Font Size 10 | Name: <block fSize='10'>%Name";
a = mySC[0][1].Annotation = new Annotation(); a.DynamicSize = false; a.Label.Text = "Verdana Font | Name: <block fName='verdana'>%Name";
a = mySC[0][2].Annotation = new Annotation(); a.DynamicSize = false; a.Label.Text = "Red Font | Name: <block fColor='red'>%Name";
a = mySC[0][3].Annotation = new Annotation(); a.DynamicSize = false; a.Label.Text = "Digital & Colored | Name: <block fColor='blue' digital='yes'>%Name";
a = mySC[0][4].Annotation = new Annotation(); a.DynamicSize = false; a.Label.Text = "Glowing | Name: <block glowColor='yellow'>%Name";
a = mySC[0][5].Annotation = new Annotation(); a.DynamicSize = false; a.Label.Text = "Outlined | Name: <block outlineColor='Green'>%Name";
a = mySC[0][6].Annotation = new Annotation(); a.DynamicSize = false; a.Label.Text = "Bold | Name: <block fStyle='bold'>%Name";
a = mySC[0][7].Annotation = new Annotation(); a.DynamicSize = false; a.Label.Text = "Italic | Name: <block fStyle='italic'>%Name";
a = mySC[0][8].Annotation = new Annotation(); a.DynamicSize = false; a.Label.Text = "Underlined | Name: <block fStyle='underline'>%Name";
a = mySC[0][9].Annotation = new Annotation(); a.DynamicSize = false; a.Label.Text = "Strikeout | Name: <block fStyle='strikeout'>%Name";
// *DYNAMIC DATA NOTE* // This sample uses random data to populate the chart. To populate // a chart with database data see the following resources: // - Use the getLiveData() method using the dataEngine to query a database. // - Help File > Getting Started > Data Tutorials // - DataEngine Class in the help file // - Sample: features/DataEngine.aspx // Add the random data. Chart.SeriesCollection.Add(mySC); }
SeriesCollection getRandomData() { Random myR = new Random(4); SeriesCollection SC = new SeriesCollection(); int a = 0; int b = 0; for (a = 1; a < 2; a++) { Series s = new Series("Series " + a.ToString()); for (b = 1; b < 11; b++) { Element e = new Element("Element " + b.ToString()); e.YValue = myR.Next(50); e.YValue = b; s.Elements.Add(e); } SC.Add(s); } return SC; }
SeriesCollection getLiveData() { DataEngine de = new DataEngine("ConnectionString goes here"); de.ChartObject = Chart; // Necessary to view any errors the dataEngine may throw. de.SqlStatement = "SELECT XAxisColumn, YAxisColumn FROM ...."; return de.GetSeries(); }
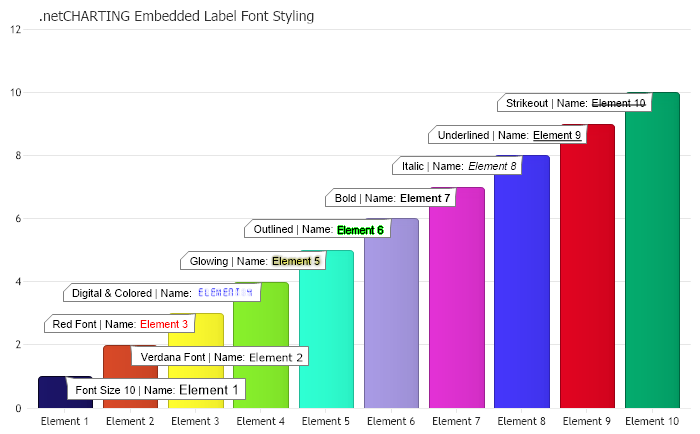
Sub Page_Load(ByVal sender As Object, ByVal e As EventArgs) ' Demonstrates using embedded font styling with labels.
Chart.TempDirectory = "temp" Chart.Debug = True '
Chart.Type = ChartType.Combo Chart.Size = "700x450" Chart.Title = ".netCHARTING Embedded Label Font Styling" Chart.YAxis.Interval = 2 Chart.LegendBox.Visible = False Chart.DefaultElement.Annotation.Background.Color = Color.FromArgb(255, Color.White) Dim mySC As SeriesCollection = getRandomData()
mySC(0).PaletteName = Palette.Bright
Dim a As Annotation = New Annotation() mySC(0)(0).Annotation = a a.DynamicSize = False a.Label.Text = "Font Size 10 | Name: <block fSize='10'>%Name"
mySC(0)(1).Annotation = New Annotation() a = mySC(0)(1).Annotation a.DynamicSize = False a.Label.Text = "Verdana Font | Name: <block fName='verdana'>%Name"
mySC(0)(2).Annotation = New Annotation() a = mySC(0)(2).Annotation a.DynamicSize = False a.Label.Text = "Red Font | Name: <block fColor='red'>%Name"
mySC(0)(3).Annotation = New Annotation() a = mySC(0)(3).Annotation a.DynamicSize = False a.Label.Text = "Digital & Colored | Name: <block fColor='blue' digital='yes'>%Name"
mySC(0)(4).Annotation = New Annotation() a = mySC(0)(4).Annotation a.DynamicSize = False a.Label.Text = "Glowing | Name: <block glowColor='yellow'>%Name"
mySC(0)(5).Annotation = New Annotation() a = mySC(0)(5).Annotation a.DynamicSize = False a.Label.Text = "Outlined | Name: <block outlineColor='Green'>%Name"
mySC(0)(6).Annotation = New Annotation() a = mySC(0)(6).Annotation a.DynamicSize = False a.Label.Text = "Bold | Name: <block fStyle='bold'>%Name"
mySC(0)(7).Annotation = New Annotation() a = mySC(0)(7).Annotation a.DynamicSize = False a.Label.Text = "Italic | Name: <block fStyle='italic'>%Name"
mySC(0)(8).Annotation = New Annotation() a = mySC(0)(8).Annotation a.DynamicSize = False a.Label.Text = "Underlined | Name: <block fStyle='underline'>%Name"
mySC(0)(9).Annotation = New Annotation() a = mySC(0)(9).Annotation a.DynamicSize = False a.Label.Text = "Strikeout | Name: <block fStyle='strikeout'>%Name"
' *DYNAMIC DATA NOTE* ' This sample uses random data to populate the chart. To populate ' a chart with database data see the following resources: ' - Use the getLiveData() method using the dataEngine to query a database. ' - Help File > Getting Started > Data Tutorials ' - DataEngine Class in the help file ' - Sample: features/DataEngine.aspx ' Add the random data. Chart.SeriesCollection.Add(mySC) End Sub
Function getRandomData() As SeriesCollection Dim myR As Random = New Random(4) Dim SC As SeriesCollection = New SeriesCollection() Dim a As Integer = 0 Dim b As Integer = 0 For a = 1 To 1 Dim s As Series = New Series("Series " & a.ToString()) For b = 1 To 10 Dim e As Element = New Element("Element " & b.ToString()) e.YValue = myR.Next(50) e.YValue = b s.Elements.Add(e) Next b SC.Add(s) Next a Return SC End Function
Function getLiveData() As SeriesCollection Dim de As DataEngine = New DataEngine("ConnectionString goes here") de.ChartObject = Chart ' Necessary to view any errors the dataEngine may throw. de.SqlStatement = "SELECT XAxisColumn, YAxisColumn FROM ...." Return de.GetSeries() End Function