void Page_Load(Object sender, EventArgs e) { // Demonstrates how text blocks can automatically align.
Chart.TempDirectory = "temp"; Chart.Debug = true;
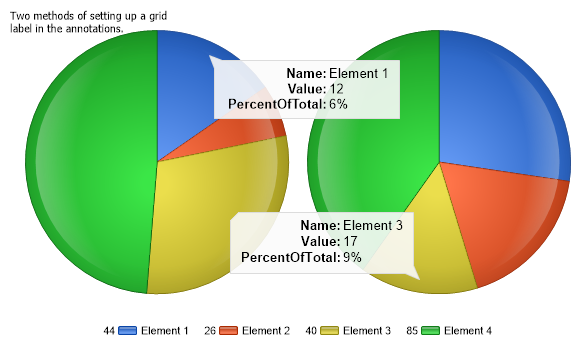
Chart.Type = ChartType.Pies ; Chart.Size = "600x350"; //Chart.Title = ".netCHARTING Sample"; Chart.ChartArea.Label.Text = "Two methods of setting up a grid \nlabel in the annotations."; Chart.ChartArea.Padding = 20; Chart.ShadingEffectMode = ShadingEffectMode.Three;
// *DYNAMIC DATA NOTE* // This sample uses random data to populate the chart. To populate // a chart with database data see the following resources: // - Use the getLiveData() method using the dataEngine to query a database. // - Help File > Getting Started > Data Tutorials // - DataEngine Class in the help file // - Sample: features/DataEngine.aspx
SeriesCollection mySC = getRandomData();
// This string uses two blocks. The disadvantage is that if one of the blocks used a different font, it wouldnt align perfectly with the other block. string st = "<block hAlign='right' fStyle='bold'>Name:<br>Value:<br>PercentOfTotal:<block hAlign='left'>%Name<br>%YValue<br>%PercentOfTotal";
// This method uses a block for each element, six in total. It is more complicated but different fonts can be used and alignment will be maintained. string st2 = "<block hAlign='right' fStyle='bold'>Name:<block hAlign='left'>%Name<row><block hAlign='right' fStyle='bold'>Value:<block hAlign='left'>%YValue<row><block hAlign='right' fStyle='bold'>PercentOfTotal:<block hAlign='left'>%PercentOfTotal";
mySC[0][0].Annotation = new Annotation(st); mySC[1][2].Annotation = new Annotation(st2);
// Add the random data. Chart.SeriesCollection.Add(mySC); }
SeriesCollection getRandomData() { Random myR = new Random(1); SeriesCollection SC = new SeriesCollection(); int a = 0; int b = 0; for (a = 1; a < 3; a++) { Series s = new Series(); for (b = 1; b < 5; b++) { Element e = new Element("Element " + b.ToString()); e.YValue = myR.Next(50); s.Elements.Add(e); } SC.Add(s); } return SC; }
SeriesCollection getLiveData() { DataEngine de = new DataEngine("ConnectionString goes here"); de.ChartObject = Chart; // Necessary to view any errors the dataEngine may throw. de.SqlStatement = "SELECT XAxisColumn, YAxisColumn FROM ...."; return de.GetSeries(); }
Sub Page_Load(ByVal sender As Object, ByVal e As EventArgs) ' Demonstrates how text blocks can automatically align.
Chart.TempDirectory = "temp" Chart.Debug = True
Chart.Type = ChartType.Pies Chart.Size = "600x350" 'Chart.Title = ".netCHARTING Sample"; Chart.ChartArea.Label.Text = "Two methods of setting up a grid " & Constants.vbLf & "label in the annotations." Chart.ChartArea.Padding = 20 Chart.ShadingEffectMode = ShadingEffectMode.Three
' *DYNAMIC DATA NOTE* ' This sample uses random data to populate the chart. To populate ' a chart with database data see the following resources: ' - Use the getLiveData() method using the dataEngine to query a database. ' - Help File > Getting Started > Data Tutorials ' - DataEngine Class in the help file ' - Sample: features/DataEngine.aspx
Dim mySC As SeriesCollection = getRandomData()
' This string uses two blocks. The disadvantage is that if one of the blocks used a different font, it wouldnt align perfectly with the other block. Dim st As String = "<block hAlign='right' fStyle='bold'>Name:<br>Value:<br>PercentOfTotal:<block hAlign='left'>%Name<br>%YValue<br>%PercentOfTotal"
' This method uses a block for each element, six in total. It is more complicated but different fonts can be used and alignment will be maintained. Dim st2 As String = "<block hAlign='right' fStyle='bold'>Name:<block hAlign='left'>%Name<row><block hAlign='right' fStyle='bold'>Value:<block hAlign='left'>%YValue<row><block hAlign='right' fStyle='bold'>PercentOfTotal:<block hAlign='left'>%PercentOfTotal"
mySC(0)(0).Annotation = New Annotation(st) mySC(1)(2).Annotation = New Annotation(st2)
' Add the random data. Chart.SeriesCollection.Add(mySC) End Sub
Function getRandomData() As SeriesCollection Dim myR As Random = New Random(1) Dim SC As SeriesCollection = New SeriesCollection() Dim a As Integer = 0 Dim b As Integer = 0 For a = 1 To 2 Dim s As Series = New Series() For b = 1 To 4 Dim e As Element = New Element("Element " & b.ToString()) e.YValue = myR.Next(50) s.Elements.Add(e) Next b SC.Add(s) Next a Return SC End Function
Function getLiveData() As SeriesCollection Dim de As DataEngine = New DataEngine("ConnectionString goes here") de.ChartObject = Chart ' Necessary to view any errors the dataEngine may throw. de.SqlStatement = "SELECT XAxisColumn, YAxisColumn FROM ...." Return de.GetSeries() End Function