Items 4
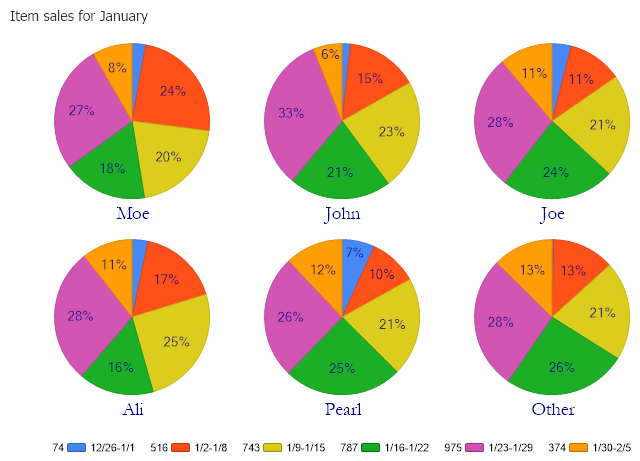
Item sales for January 2002 by Weeks, split by customer showing top 5 customers and grouping all others together and demonstrates how to set fonts and colors on pies.
<%@ Page Language="C#" Description="dotnetCHARTING Component"%>
<%@ Register TagPrefix="dotnet" Namespace="dotnetCHARTING" Assembly="dotnetCHARTING"%>
<%@ Import Namespace="System.Drawing" %>
<script runat="server">
void Page_Load(Object sender,EventArgs e)
{
//set global properties
Chart.Title="Item sales for January";
Chart.ChartArea.YAxis.Label.Text="Orders";
Chart.ShowDateInTitle =false;
Chart.Type=ChartType.Pie;
Chart.TempDirectory="temp";
Chart.Debug=true;
Chart.DefaultSeries.ShowOther=true;
Chart.DefaultSeries.DefaultElement.ShowValue=true;
Chart.LegendBox.Position=LegendBoxPosition.BottomMiddle;
Chart.DateGrouping = TimeInterval.Weeks;
Chart.PieLabelMode =PieLabelMode.Inside;
Chart.OverlapFooter=false;
Chart.Size = "700x480";
Chart.MarginTop = 10;
//setting fonts and colors
Chart.ChartArea.DefaultElement.SmartLabel.Font = new Font("Garamond Bold", 10);
Chart.ChartArea.DefaultElement.SmartLabel.Color = Color.FromArgb(200, Color.DarkBlue);
Chart.ChartArea.XAxis.Label = new dotnetCHARTING.Label("%name",new Font("Garamond",14),Color.DarkBlue);
Chart.DefaultSeries.ConnectionString = ConfigurationManager.AppSettings["DNCConnectionString"];
Chart.DefaultSeries.StartDate=new System.DateTime(2022,1,1,0,0,0);
Chart.DefaultSeries.EndDate = new System.DateTime(2022,1,31,23,59,59);
//Add a series
Chart.Series.SqlStatement= @"SELECT OrderDate,Sum(Quantity) AS CountOfQuantity, Name FROM Orders WHERE OrderDate >= #STARTDATE# AND OrderDate <= #ENDDATE# GROUP BY Orders.OrderDate, Orders.Name ORDER BY Orders.OrderDate";
Chart.Series.SplitByLimit="5";
Chart.SeriesCollection.Add();
}
</script>
<html xmlns="http://www.w3.org/1999/xhtml"><head><title>Orders Report</title></head>
<body>
<div style="text-align:center">
<dotnet:Chart id="Chart" runat="server"/>
</div>
</body>
</html>
<%@ Page Language="vb" Description="dotnetCHARTING Component"%>
<%@ Register TagPrefix="dotnet" Namespace="dotnetCHARTING" Assembly="dotnetCHARTING"%>
<%@ Import Namespace="System.Drawing" %>
<script runat="server">
Sub Page_Load(ByVal sender As Object, ByVal e As EventArgs)
'set global properties
Chart.Title="Item sales for January"
Chart.ChartArea.YAxis.Label.Text="Orders"
Chart.ShowDateInTitle =False
Chart.Type=ChartType.Pie
Chart.TempDirectory="temp"
Chart.Debug=True
Chart.DefaultSeries.ShowOther=True
Chart.DefaultSeries.DefaultElement.ShowValue=True
Chart.LegendBox.Position=LegendBoxPosition.BottomMiddle
Chart.DateGrouping = TimeInterval.Weeks
Chart.PieLabelMode =PieLabelMode.Inside
Chart.OverlapFooter=False
Chart.Size = "700x480"
Chart.MarginTop = 10
'setting fonts and colors
Chart.ChartArea.DefaultElement.SmartLabel.Font = New Font("Garamond Bold", 10)
Chart.ChartArea.DefaultElement.SmartLabel.Color = Color.FromArgb(200, Color.DarkBlue)
Chart.ChartArea.XAxis.Label = New dotnetCHARTING.Label("%name",New Font("Garamond",14),Color.DarkBlue)
Chart.DefaultSeries.ConnectionString = ConfigurationManager.AppSettings("DNCConnectionString")
Chart.DefaultSeries.StartDate = New System.DateTime(2022,1,1,0,0,0)
Chart.DefaultSeries.EndDate = New System.DateTime(2022,1,31,23,59,59)
'Add a series
Chart.Series.SqlStatement= "SELECT OrderDate,Sum(Quantity) AS CountOfQuantity, Name FROM Orders WHERE OrderDate >= #STARTDATE# AND OrderDate <= #ENDDATE# GROUP BY Orders.OrderDate, Orders.Name ORDER BY Orders.OrderDate"
Chart.Series.SplitByLimit="5"
Chart.SeriesCollection.Add()
End Sub
</script>
<html xmlns="http://www.w3.org/1999/xhtml"><head><title>Orders Report</title></head>
<body>
<div style="text-align:center">
<dotnet:Chart id="Chart" runat="server"/>
</div>
</body>
</html>