// First we get our data, if you would like to get the data from a database you need to use // the data engine. See sample: features/dataEngine.aspx. Or the dataEngine tutorial in the help file. SeriesCollection mySC = getRandomData();
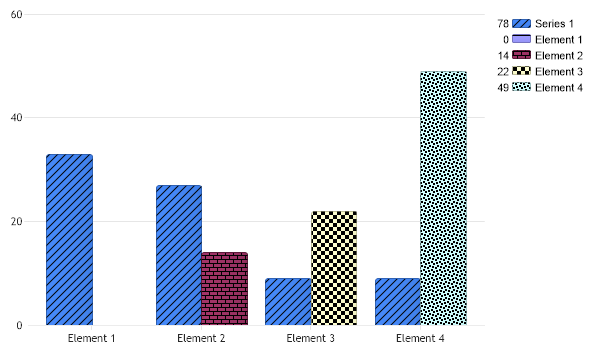
// Set a default hatch palette name Chart.HatchStylePaletteName = HatchStylePalette.One; // Palette.One, Two, and Three are available for hatch styles.
// Hatch color must be selected. Chart.DefaultSeries.DefaultElement.HatchColor = Color.Black;
// Set the hatch palette name for a series which will give each element it's own hatch. mySC[1].HatchStylePaletteName = HatchStylePalette.Two; // Giving the series a color palette name will place each element into the legend box. mySC[1].PaletteName = Palette.One;
// Add the random data. Chart.SeriesCollection.Add(mySC);
}
SeriesCollection getRandomData() { SeriesCollection SC = new SeriesCollection(); Random myR = new Random(); for(int a = 1; a < 3; a++) { Series s = new Series(); s.Name = "Series " + a; for(int b = 1; b < 5; b++) { Element e = new Element(); e.Name = "Element " + b; //e.YValue = -25 + myR.Next(50); e.YValue = myR.Next(50); s.Elements.Add(e); } SC.Add(s); }
' First we get our data, if you would like to get the data from a database you need to use ' the data engine. See sample: features/dataEngine.aspx. Or the dataEngine tutorial in the help file. Dim mySC As SeriesCollection = getRandomData()
' Set a default hatch palette name Chart.HatchStylePaletteName = HatchStylePalette.One ' Palette.One, Two, and Three are available for hatch styles.
' Hatch color must be selected. Chart.DefaultSeries.DefaultElement.HatchColor = Color.Black
' Set the hatch palette name for a series which will give each element it's own hatch. mySC(1).HatchStylePaletteName = HatchStylePalette.Two ' Giving the series a color palette name will place each element into the legend box. mySC(1).PaletteName = Palette.One
' Add the random data. Chart.SeriesCollection.Add(mySC)
End Sub
Function getRandomData() As SeriesCollection Dim SC As SeriesCollection = New SeriesCollection() Dim myR As Random = New Random() For a As Integer = 1 To 2 Dim s As Series = New Series() s.Name = "Series " & a For b As Integer = 1 To 4 Dim e As Element = New Element() e.Name = "Element " & b 'e.YValue = -25 + myR.Next(50); e.YValue = myR.Next(50) s.Elements.Add(e) Next b SC.Add(s) Next a
Return SC End Function </script> </head> <body> <div style="text-align:center"> <dotnet:Chart id="Chart" runat="server" Width="568px" Height="344px"> </dotnet:Chart> </div> </body> </html>