Gallery
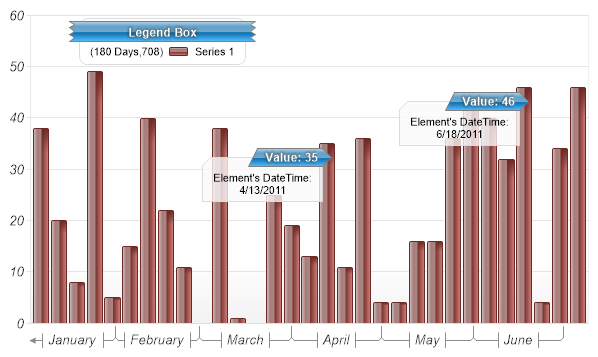
Element Annotation Header
<%@ Page Language="C#" Description="dotnetCHARTING Component" %>
<%@ Register TagPrefix="dnc" Namespace="dotnetCHARTING" Assembly="dotnetCHARTING" %>
<%@ Import Namespace="System.Drawing" %>
<%@ Import Namespace="System.Drawing.Drawing2D" %>
<%@ Import Namespace="dotnetCHARTING.Mapping" %>
<script runat="server">
void Page_Load(Object sender, EventArgs e)
{
// Demonstrates using an annotation with a header on elements.
Chart.Size = "600x350";
//Chart.Title = ".netCHARTING Sample";
Chart.TempDirectory = "temp";
Chart.Debug = true;
Chart.Palette = new Color[] { Color.FromArgb(150, 56, 50) };
//--- Apply Stying settings.
Chart.ChartArea.Background.Color = Color.White;
Chart.ShadingEffectMode = ShadingEffectMode.Two;
Chart.TitleBox.CornerTopLeft = BoxCorner.Round;
Chart.TitleBox.CornerTopRight = BoxCorner.Round;
Chart.TitleBox.Position = TitleBoxPosition.Right;
Chart.DefaultAxis.DefaultTick.Label.Font = new Font("Arial", 10, FontStyle.Italic);
Chart.XAxis.TimeInterval = TimeInterval.Week;
Chart.YAxis.AlternateGridBackground.Color = Color.Empty;
Chart.XAxis.DefaultTick.GridLine.Color = Color.Transparent;
Chart.TitleBox.Background.ShadingEffectMode = ShadingEffectMode.Two;
Chart.TitleBox.Background.Color = Color.FromArgb(0, 156, 255);
Chart.TitleBox.Label.Color = Color.White;
Chart.TitleBox.Label.GlowColor = Color.Gray;
Chart.TitleBox.Label.Shadow.Depth = 1;
Chart.TitleBox.Padding = 5;
Chart.LegendBox.Position = new Point(80, 15);
Chart.LegendBox.Background.Color = Color.White;
Chart.LegendBox.HeaderLabel = new dotnetCHARTING.Label("Legend Box", new Font("Arial", 9, FontStyle.Bold), Color.White);
Chart.LegendBox.HeaderLabel.Alignment = StringAlignment.Center;
Chart.LegendBox.HeaderBackground.ShadingEffectMode = ShadingEffectMode.Two;
Chart.LegendBox.HeaderBackground.Color = Color.FromArgb(0, 156, 255);
Chart.LegendBox.HeaderLabel.GlowColor = Color.Gray;
Chart.LegendBox.HeaderLabel.Shadow.Depth = 1;
Chart.LegendBox.Header.StartCap = BoxCapStyle.Torn;
Chart.LegendBox.Header.EndCap = BoxCapStyle.Torn;
Chart.LegendBox.Header.Offset = new Point(0, 3);
Chart.LegendBox.DefaultCorner = BoxCorner.Round;
Chart.LegendBox.Padding = 7;
//---
Chart.XAxis.TimeScaleLabels.Mode = TimeScaleLabelMode.Hidden;
Chart.XAxis.TimeScaleLabels.RangeMode = TimeScaleLabelRangeMode.Dynamic;
// *DYNAMIC DATA NOTE*
// This sample uses random data to populate the chart. To populate
// a chart with database data see the following resources:
// - Use the getLiveData() method using the dataEngine to query a database.
// - Help File > Getting Started > Data Tutorials
// - DataEngine Class in the help file
// - Sample: features/DataEngine.aspx
SeriesCollection mySC = getRandomData();
// Add the random data.
Chart.SeriesCollection.Add(mySC);
mySC[0][16].Annotation = getStyledAnnotation();
mySC[0][27].Annotation = getStyledAnnotation();
}
Annotation getStyledAnnotation()
{
Annotation an = new Annotation("Element's DateTime: %XValue");
an.Size = new Size(120, 0);
an.Header.Label.Text = "Value: %YValue";
an.Header.Label.Alignment = StringAlignment.Far;
an.Header.Label.Color = Color.White;
an.Header.Label.Font = new Font("Arial", 9, FontStyle.Bold);
an.Header.Background.Color = Color.FromArgb(0, 156, 255);
an.Header.Background.ShadingEffectMode = ShadingEffectMode.Two;
an.Header.Label.GlowColor = Color.Gray;
an.Header.StartAlignment = EdgeAlignment.Inside;
an.Header.VerticalAlignment = EdgeAlignment.Edge;
an.Header.StartCap = BoxCapStyle.CutDown;
an.Header.EndCap = BoxCapStyle.Triangle;
an.Orientation = dotnetCHARTING.Orientation.BottomLeft;
return an;
}
SeriesCollection getRandomData()
{
Random myR = new Random(2);
SeriesCollection SC = new SeriesCollection();
DateTime dt = new DateTime(2011, 1, 1);
Series s = new Series("Series 1");
for (int b = 1; b < 32; b++)
{
Element e = new Element();
e.XDateTime = dt = dt.AddDays(6);
e.YValue = myR.Next(50);
s.Elements.Add(e);
}
SC.Add(s);
return SC;
}
SeriesCollection getLiveData()
{
DataEngine de = new DataEngine("ConnectionString goes here");
de.ChartObject = Chart; // Necessary to view any errors the dataEngine may throw.
de.SqlStatement = "SELECT XAxisColumn, YAxisColumn FROM ....";
return de.GetSeries();
}
</script>
<html xmlns="http://www.w3.org/1999/xhtml">
<head>
<title>.netCHARTING Sample</title>
</head>
<body>
<div align="center">
<dnc:Chart ID="Chart" runat="server" />
</div>
</body>
</html>
<%@ Page Language="vb" Description="dotnetCHARTING Component" %>
<%@ Register TagPrefix="dnc" Namespace="dotnetCHARTING" Assembly="dotnetCHARTING" %>
<%@ Import Namespace="System.Drawing" %>
<%@ Import Namespace="System.Drawing.Drawing2D" %>
<%@ Import Namespace="dotnetCHARTING.Mapping" %>
<script runat="server">
Sub Page_Load(ByVal sender As Object, ByVal e As EventArgs)
' Demonstrates using an annotation with a header on elements.
Chart.Size = "600x350"
'Chart.Title = ".netCHARTING Sample";
Chart.TempDirectory = "temp"
Chart.Debug = True
Chart.Palette = New Color() { Color.FromArgb(150, 56, 50) }
'--- Apply Stying settings.
Chart.ChartArea.Background.Color = Color.White
Chart.ShadingEffectMode = ShadingEffectMode.Two
Chart.TitleBox.CornerTopLeft = BoxCorner.Round
Chart.TitleBox.CornerTopRight = BoxCorner.Round
Chart.TitleBox.Position = TitleBoxPosition.Right
Chart.DefaultAxis.DefaultTick.Label.Font = New Font("Arial", 10, FontStyle.Italic)
Chart.XAxis.TimeInterval = TimeInterval.Week
Chart.YAxis.AlternateGridBackground.Color = Color.Empty
Chart.XAxis.DefaultTick.GridLine.Color = Color.Transparent
Chart.TitleBox.Background.ShadingEffectMode = ShadingEffectMode.Two
Chart.TitleBox.Background.Color = Color.FromArgb(0, 156, 255)
Chart.TitleBox.Label.Color = Color.White
Chart.TitleBox.Label.GlowColor = Color.Gray
Chart.TitleBox.Label.Shadow.Depth = 1
Chart.TitleBox.Padding = 5
Chart.LegendBox.Position = New Point(80, 15)
Chart.LegendBox.Background.Color = Color.White
Chart.LegendBox.HeaderLabel = New dotnetCHARTING.Label("Legend Box", New Font("Arial", 9, FontStyle.Bold), Color.White)
Chart.LegendBox.HeaderLabel.Alignment = StringAlignment.Center
Chart.LegendBox.HeaderBackground.ShadingEffectMode = ShadingEffectMode.Two
Chart.LegendBox.HeaderBackground.Color = Color.FromArgb(0, 156, 255)
Chart.LegendBox.HeaderLabel.GlowColor = Color.Gray
Chart.LegendBox.HeaderLabel.Shadow.Depth = 1
Chart.LegendBox.Header.StartCap = BoxCapStyle.Torn
Chart.LegendBox.Header.EndCap = BoxCapStyle.Torn
Chart.LegendBox.Header.Offset = New Point(0, 3)
Chart.LegendBox.DefaultCorner = BoxCorner.Round
Chart.LegendBox.Padding = 7
'---
Chart.XAxis.TimeScaleLabels.Mode = TimeScaleLabelMode.Hidden
Chart.XAxis.TimeScaleLabels.RangeMode = TimeScaleLabelRangeMode.Dynamic
' *DYNAMIC DATA NOTE*
' This sample uses random data to populate the chart. To populate
' a chart with database data see the following resources:
' - Use the getLiveData() method using the dataEngine to query a database.
' - Help File > Getting Started > Data Tutorials
' - DataEngine Class in the help file
' - Sample: features/DataEngine.aspx
Dim mySC As SeriesCollection = getRandomData()
' Add the random data.
Chart.SeriesCollection.Add(mySC)
mySC(0)(16).Annotation = getStyledAnnotation()
mySC(0)(27).Annotation = getStyledAnnotation()
End Sub
Function getStyledAnnotation() As Annotation
Dim an As Annotation = New Annotation("Element's DateTime: %XValue")
an.Size = New Size(120, 0)
an.Header.Label.Text = "Value: %YValue"
an.Header.Label.Alignment = StringAlignment.Far
an.Header.Label.Color = Color.White
an.Header.Label.Font = New Font("Arial", 9, FontStyle.Bold)
an.Header.Background.Color = Color.FromArgb(0, 156, 255)
an.Header.Background.ShadingEffectMode = ShadingEffectMode.Two
an.Header.Label.GlowColor = Color.Gray
an.Header.StartAlignment = EdgeAlignment.Inside
an.Header.VerticalAlignment = EdgeAlignment.Edge
an.Header.StartCap = BoxCapStyle.CutDown
an.Header.EndCap = BoxCapStyle.Triangle
an.Orientation = dotnetCHARTING.Orientation.BottomLeft
Return an
End Function
Function getRandomData() As SeriesCollection
Dim myR As Random = New Random(2)
Dim SC As SeriesCollection = New SeriesCollection()
Dim dt As DateTime = New DateTime(2011, 1, 1)
Dim s As Series = New Series("Series 1")
For b As Integer = 1 To 31
Dim e As Element = New Element()
dt = dt.AddDays(6)
e.XDateTime = dt
e.YValue = myR.Next(50)
s.Elements.Add(e)
Next b
SC.Add(s)
Return SC
End Function
Function getLiveData() As SeriesCollection
Dim de As DataEngine = New DataEngine("ConnectionString goes here")
de.ChartObject = Chart ' Necessary to view any errors the dataEngine may throw.
de.SqlStatement = "SELECT XAxisColumn, YAxisColumn FROM ...."
Return de.GetSeries()
End Function
</script>
<html xmlns="http://www.w3.org/1999/xhtml">
<head>
<title>.netCHARTING Sample</title>
</head>
<body>
<div align="center">
<dnc:Chart ID="Chart" runat="server" />
</div>
</body>
</html>
- Sample FilenameElementAnnotationHeader.aspx
- Version6.1
- Uses DatabaseNo