Gallery
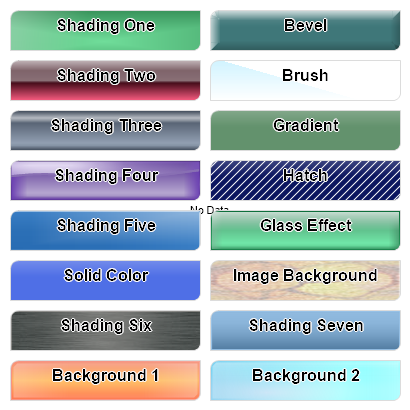
Box Styling
<%@ Page Language="C#" Description="dotnetCHARTING Component" %>
<%@ Register TagPrefix="dotnet" Namespace="dotnetCHARTING" Assembly="dotnetCHARTING" %>
<%@ Import Namespace="System.Drawing" %>
<%@ Import Namespace="System.Drawing.Drawing2D" %>
<%@ Import Namespace="dotnetCHARTING.Mapping" %>
<script runat="server">
void Page_Load(Object sender, EventArgs e)
{
// Demonstrates a number of background styling options which used to fill boxes and other objects.
Chart.TempDirectory = "temp";
Chart.Debug = true;
Chart.Type = ChartType.Combo;
Chart.Size = "500x480";
Chart.ChartArea.ClearColors();
Chart.ChartArea.Line.Color = Color.Black;
Chart.Palette = new Color[] { Color.Transparent };
Chart.DefaultShadow.Color = Color.Empty;
Chart.LegendBox.Visible = false;
Chart.DefaultAxis.ClearValues = true;
Chart.DefaultElement.Outline.Color = Color.Transparent;
Chart.DefaultBox.CornerBottomRight = BoxCorner.Round;
Chart.DefaultBox.CornerTopLeft = BoxCorner.Round;
Annotation a1 = getAnnotation("Shading One");
Annotation a2 = getAnnotation("Shading Two");
Annotation a3 = getAnnotation("Shading Three");
Annotation a4 = getAnnotation("Shading Four");
Annotation a5 = getAnnotation("Shading Five");
Annotation a6 = getAnnotation("Bevel");
Annotation a7 = getAnnotation("Brush");
Annotation a8 = getAnnotation("Gradient");
Annotation a9 = getAnnotation("Hatch");
Annotation a10 = getAnnotation("Glass Effect");
Annotation a11 = getAnnotation("Solid Color");
Annotation a12 = getAnnotation("Image Background");
Annotation a13 = getAnnotation("Shading Six");
Annotation a14 = getAnnotation("Shading Seven");
Annotation a15 = getAnnotation("Background 1");
Annotation a16 = getAnnotation("Background 2");
a1.Position = new Point(50, 40);
a2.Position = new Point(50, 90);
a3.Position = new Point(50, 140);
a4.Position = new Point(50, 190);
a5.Position = new Point(50, 240);
a6.Position = new Point(250, 40);
a7.Position = new Point(250, 90);
a8.Position = new Point(250, 140);
a9.Position = new Point(250, 190);
a10.Position = new Point(250, 240);
a11.Position = new Point(50, 290);
a12.Position = new Point(250, 290);
a13.Position = new Point(50, 340);
a14.Position = new Point(250, 340);
a15.Position = new Point(50, 390);
a16.Position = new Point(250, 390);
a1.Label.Alignment = StringAlignment.Center;
a2.Label.Alignment = StringAlignment.Center;
a3.Label.Alignment = StringAlignment.Center;
a4.Label.Alignment = StringAlignment.Center;
a5.Label.Alignment = StringAlignment.Center;
a6.Label.Alignment = StringAlignment.Center;
a7.Label.Alignment = StringAlignment.Center;
a8.Label.Alignment = StringAlignment.Center;
a9.Label.Alignment = StringAlignment.Center;
a10.Label.Alignment = StringAlignment.Center;
a11.Label.Alignment = StringAlignment.Center;
a12.Label.Alignment = StringAlignment.Center;
a13.Label.Alignment = StringAlignment.Center;
a14.Label.Alignment = StringAlignment.Center;
a15.Label.Alignment = StringAlignment.Center;
a16.Label.Alignment = StringAlignment.Center;
Chart.Annotations.Add(a1, a2, a3, a4, a5, a6, a7, a8, a9, a10, a11, a12,a13,a14,a15,a16);
a1.Background.ShadingEffectMode = ShadingEffectMode.One;
a2.Background.ShadingEffectMode = ShadingEffectMode.Two;
a3.Background.ShadingEffectMode = ShadingEffectMode.Three;
a4.Background.ShadingEffectMode = ShadingEffectMode.Four;
a5.Background.ShadingEffectMode = ShadingEffectMode.Five;
a13.Background.ShadingEffectMode = ShadingEffectMode.Six;
a14.Background.ShadingEffectMode = ShadingEffectMode.Seven;
a15.Background.ShadingEffectMode = ShadingEffectMode.Background1;
a16.Background.ShadingEffectMode = ShadingEffectMode.Background2;
a15.Background.Color = Color.BlanchedAlmond;
a16.Background.Color = Color.Azure;
a6.Background.Bevel = true;
PathGradientBrush pgb = new PathGradientBrush(new Point[] { new Point(250, 90), new Point(130, 90), new Point(400, 130), new Point(250, 130) });
//pgb.SurroundColors = Chart.Palette;
//pgb.CenterColor = Color.FromArgb(myRand.Next(120), myRand.Next(220), myRand.Next(255));
//pgb.CenterPoint = new PointF(275, 120);
pgb.SurroundColors = Chart.Palette;
pgb.CenterColor = Color.FromArgb(120, 220, 255);
pgb.CenterPoint = new PointF(0, 15);
a7.Background = new Background(pgb);
//a8.Background = new Background();
a8.Background.Colors = new Color[] {Color.Blue, Color.White,Color.Green };
//a8.Background = new Background(Color.FromArgb(myRand.Next(120), myRand.Next(220), myRand.Next(255)), Color.White, 90);//SecondaryColor = Color.White;
a9.Background.HatchColor = Color.White;
a9.Background.HatchStyle = HatchStyle.BackwardDiagonal;
a10.Background.GlassEffect = true;
a12.Background = new Background("../../images/back038.jpg");
// *DYNAMIC DATA NOTE*
// This sample uses random data to populate the chart. To populate
// a chart with database data see the following resources:
// - Help File > Getting Started > Data Tutorials
// - DataEngine Class in the help file
// - Sample: features/DataEngine.aspx
}
Random myRand = new Random(4);
Annotation getAnnotation(string text)
{
Annotation an = new Annotation();
an.Label.Text = text;
an.Label.Font = new Font("Arial", 12, FontStyle.Bold);
an.Label.OutlineColor = Color.White;
an.Background.Color = Color.FromArgb(myRand.Next(120), myRand.Next(220), myRand.Next(255));
an.Size = new Size(190, 40);
return an;
}
</script>
<html xmlns="http://www.w3.org/1999/xhtml">
<head>
<title>.netCHARTING Sample</title>
</head>
<body>
<div align="center">
<dotnet:Chart ID="Chart" runat="server" />
</div>
</body>
</html>
<%@ Page Language="vb" Description="dotnetCHARTING Component" %>
<%@ Register TagPrefix="dotnet" Namespace="dotnetCHARTING" Assembly="dotnetCHARTING" %>
<%@ Import Namespace="System.Drawing" %>
<%@ Import Namespace="System.Drawing.Drawing2D" %>
<%@ Import Namespace="dotnetCHARTING.Mapping" %>
<script runat="server">
Sub Page_Load(ByVal sender As Object, ByVal e As EventArgs)
' Demonstrates a number of background styling options which used to fill boxes and other objects.
Chart.TempDirectory = "temp"
Chart.Debug = True
Chart.Type = ChartType.Combo
Chart.Size = "500x480"
Chart.ChartArea.ClearColors()
Chart.ChartArea.Line.Color = Color.Black
Chart.Palette = New Color() { Color.Transparent }
Chart.DefaultShadow.Color = Color.Empty
Chart.LegendBox.Visible = False
Chart.DefaultAxis.ClearValues = True
Chart.DefaultElement.Outline.Color = Color.Transparent
Chart.DefaultBox.CornerBottomRight = BoxCorner.Round
Chart.DefaultBox.CornerTopLeft = BoxCorner.Round
Dim a1 As Annotation = getAnnotation("Shading One")
Dim a2 As Annotation = getAnnotation("Shading Two")
Dim a3 As Annotation = getAnnotation("Shading Three")
Dim a4 As Annotation = getAnnotation("Shading Four")
Dim a5 As Annotation = getAnnotation("Shading Five")
Dim a6 As Annotation = getAnnotation("Bevel")
Dim a7 As Annotation = getAnnotation("Brush")
Dim a8 As Annotation = getAnnotation("Gradient")
Dim a9 As Annotation = getAnnotation("Hatch")
Dim a10 As Annotation = getAnnotation("Glass Effect")
Dim a11 As Annotation = getAnnotation("Solid Color")
Dim a12 As Annotation = getAnnotation("Image Background")
Dim a13 As Annotation = getAnnotation("Shading Six")
Dim a14 As Annotation = getAnnotation("Shading Seven")
Dim a15 As Annotation = getAnnotation("Background 1")
Dim a16 As Annotation = getAnnotation("Background 2")
a1.Position = New Point(50, 40)
a2.Position = New Point(50, 90)
a3.Position = New Point(50, 140)
a4.Position = New Point(50, 190)
a5.Position = New Point(50, 240)
a6.Position = New Point(250, 40)
a7.Position = New Point(250, 90)
a8.Position = New Point(250, 140)
a9.Position = New Point(250, 190)
a10.Position = New Point(250, 240)
a11.Position = New Point(50, 290)
a12.Position = New Point(250, 290)
a13.Position = New Point(50, 340)
a14.Position = New Point(250, 340)
a15.Position = New Point(50, 390)
a16.Position = New Point(250, 390)
a1.Label.Alignment = StringAlignment.Center
a2.Label.Alignment = StringAlignment.Center
a3.Label.Alignment = StringAlignment.Center
a4.Label.Alignment = StringAlignment.Center
a5.Label.Alignment = StringAlignment.Center
a6.Label.Alignment = StringAlignment.Center
a7.Label.Alignment = StringAlignment.Center
a8.Label.Alignment = StringAlignment.Center
a9.Label.Alignment = StringAlignment.Center
a10.Label.Alignment = StringAlignment.Center
a11.Label.Alignment = StringAlignment.Center
a12.Label.Alignment = StringAlignment.Center
a13.Label.Alignment = StringAlignment.Center
a14.Label.Alignment = StringAlignment.Center
a15.Label.Alignment = StringAlignment.Center
a16.Label.Alignment = StringAlignment.Center
Chart.Annotations.Add(a1, a2, a3, a4, a5, a6, a7, a8, a9, a10, a11, a12,a13,a14,a15,a16)
a1.Background.ShadingEffectMode = ShadingEffectMode.One
a2.Background.ShadingEffectMode = ShadingEffectMode.Two
a3.Background.ShadingEffectMode = ShadingEffectMode.Three
a4.Background.ShadingEffectMode = ShadingEffectMode.Four
a5.Background.ShadingEffectMode = ShadingEffectMode.Five
a13.Background.ShadingEffectMode = ShadingEffectMode.Six
a14.Background.ShadingEffectMode = ShadingEffectMode.Seven
a15.Background.ShadingEffectMode = ShadingEffectMode.Background1
a16.Background.ShadingEffectMode = ShadingEffectMode.Background2
a15.Background.Color = Color.BlanchedAlmond
a16.Background.Color = Color.Azure
a6.Background.Bevel = True
Dim pgb As PathGradientBrush = New PathGradientBrush(New Point() { New Point(250, 90), New Point(130, 90), New Point(400, 130), New Point(250, 130) })
'pgb.SurroundColors = Chart.Palette;
'pgb.CenterColor = Color.FromArgb(myRand.Next(120), myRand.Next(220), myRand.Next(255));
'pgb.CenterPoint = new PointF(275, 120);
pgb.SurroundColors = Chart.Palette
pgb.CenterColor = Color.FromArgb(120, 220, 255)
pgb.CenterPoint = New PointF(0, 15)
a7.Background = New Background(pgb)
'a8.Background = new Background();
a8.Background.Colors = New Color() {Color.Blue, Color.White,Color.Green }
'a8.Background = new Background(Color.FromArgb(myRand.Next(120), myRand.Next(220), myRand.Next(255)), Color.White, 90);//SecondaryColor = Color.White;
a9.Background.HatchColor = Color.White
a9.Background.HatchStyle = HatchStyle.BackwardDiagonal
a10.Background.GlassEffect = True
a12.Background = New Background("../../images/back038.jpg")
' *DYNAMIC DATA NOTE*
' This sample uses random data to populate the chart. To populate
' a chart with database data see the following resources:
' - Help File > Getting Started > Data Tutorials
' - DataEngine Class in the help file
' - Sample: features/DataEngine.aspx
End Sub
Dim myRand As Random = New Random(4)
Function getAnnotation(ByVal text As String) As Annotation
Dim an As Annotation = New Annotation()
an.Label.Text = text
an.Label.Font = New Font("Arial", 12, FontStyle.Bold)
an.Label.OutlineColor = Color.White
an.Background.Color = Color.FromArgb(myRand.Next(120), myRand.Next(220), myRand.Next(255))
an.Size = New Size(190, 40)
Return an
End Function
</script>
<html xmlns="http://www.w3.org/1999/xhtml">
<head>
<title>.netCHARTING Sample</title>
</head>
<body>
<div align="center">
<dotnet:Chart ID="Chart" runat="server" />
</div>
</body>
</html>
- Sample FilenameBoxStyling.aspx
- Version4.4
- Uses DatabaseNo