// Demonstrates how to create a dashboard like chart. Chart.LegendBox.Visible = false;
// we'll setup the ranges of the chart. Chart.XAxis.ScaleRange = new ScaleRange(0,10); Chart.YAxis.ScaleRange = new ScaleRange(0,1); // Clear the y axis values. Chart.YAxis.ClearValues = true;
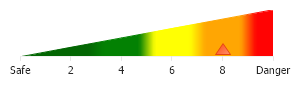
// Now we'll create the multi color background by using an area line with different colors. // Each element will be added to change the colors the area line. // In order to create the slope, each element's y value will increment until it reaches 1. Series back = new Series(""); // The markers will be eliminated because we dont need them. back.DefaultElement.Marker.Type = ElementMarkerType.None; back.Type = SeriesType.AreaLine; Element e1 = new Element("",0); e1.XValue = 0; Element e2 = new Element("",.2); e2.XValue = 2; Element e3 = new Element("",.4); e3.XValue = 4; Element e4 = new Element("",.6); e4.XValue = 6; Element e5 = new Element("",.8); e5.XValue = 8; Element e6 = new Element("",1); e6.XValue = 10; // Add the elements to the back series. back.Elements.Add(e1); back.Elements.Add(e2); back.Elements.Add(e3); back.Elements.Add(e4); back.Elements.Add(e5); back.Elements.Add(e6);
// Set the different element colors. back.Elements[0].Color = Color.DarkGreen; back.Elements[1].Color = Color.DarkGreen; back.Elements[2].Color = Color.Green; back.Elements[3].Color = Color.Yellow; back.Elements[4].Color = Color.Orange; back.Elements[5].Color = Color.Red;
// Our data will be a triangle marker series with one element Series theData = new Series(); theData.Type = SeriesType.Marker;
// The y value is .12 so the marker appers closer to the bottom. Element dataE = new Element(); dataE.YValue = .12; dataE.XValue = 8;
// Specify the exact marker appearance. dataE.Marker.Type = ElementMarkerType.Triangle; dataE.Marker.Size = 12; // Add the marker. theData.Elements.Add(dataE);
// This code will override the 0 and 10 tick on the x axis with text. Chart.XAxis.ExtraTicks.Add(new AxisTick(0,"Safe")); Chart.XAxis.ExtraTicks.Add(new AxisTick(10,"Danger"));
// Add the 2 series. // *DYNAMIC DATA NOTE* // This sample uses static data to populate the chart. To populate // a chart with database data see the following resources: // - Classic samples folder // - Help File > Data Tutorials // - Sample: features/DataEngine.aspx // Add the random data. Chart.SeriesCollection.Add(back); Chart.SeriesCollection.Add(theData);
' Demonstrates how to create a dashboard like chart. Chart.LegendBox.Visible = False
' we'll setup the ranges of the chart. Chart.XAxis.ScaleRange = New ScaleRange(0,10) Chart.YAxis.ScaleRange = New ScaleRange(0,1) ' Clear the y axis values. Chart.YAxis.ClearValues = True
' Now we'll create the multi color background by using an area line with different colors. ' Each element will be added to change the colors the area line. ' In order to create the slope, each element's y value will increment until it reaches 1. Dim back As Series = New Series("") ' The markers will be eliminated because we dont need them. back.DefaultElement.Marker.Type = ElementMarkerType.None back.Type = SeriesType.AreaLine Dim e1 As Element = New Element("",0) e1.XValue = 0 Dim e2 As Element = New Element("",.2) e2.XValue = 2 Dim e3 As Element = New Element("",.4) e3.XValue = 4 Dim e4 As Element = New Element("",.6) e4.XValue = 6 Dim e5 As Element = New Element("",.8) e5.XValue = 8 Dim e6 As Element = New Element("",1) e6.XValue = 10 ' Add the elements to the back series. back.Elements.Add(e1) back.Elements.Add(e2) back.Elements.Add(e3) back.Elements.Add(e4) back.Elements.Add(e5) back.Elements.Add(e6)
' Set the different element colors. back.Elements(0).Color = Color.DarkGreen back.Elements(1).Color = Color.DarkGreen back.Elements(2).Color = Color.Green back.Elements(3).Color = Color.Yellow back.Elements(4).Color = Color.Orange back.Elements(5).Color = Color.Red
' Our data will be a triangle marker series with one element Dim theData As Series = New Series() theData.Type = SeriesType.Marker
' The y value is .12 so the marker appers closer to the bottom. Dim dataE As Element = New Element() dataE.YValue =.12 dataE.XValue = 8
' Specify the exact marker appearance. dataE.Marker.Type = ElementMarkerType.Triangle dataE.Marker.Size = 12 ' Add the marker. theData.Elements.Add(dataE)
' This code will override the 0 and 10 tick on the x axis with text. Chart.XAxis.ExtraTicks.Add(New AxisTick(0,"Safe")) Chart.XAxis.ExtraTicks.Add(New AxisTick(10,"Danger"))
Chart.ChartArea.ClearColors() Chart.YAxis.Clear()
' Add the 2 series. ' *DYNAMIC DATA NOTE* ' This sample uses static data to populate the chart. To populate ' a chart with database data see the following resources: ' - Classic samples folder ' - Help File > Data Tutorials ' - Sample: features/DataEngine.aspx ' Add the random data. Chart.SeriesCollection.Add(back) Chart.SeriesCollection.Add(theData)