Gallery
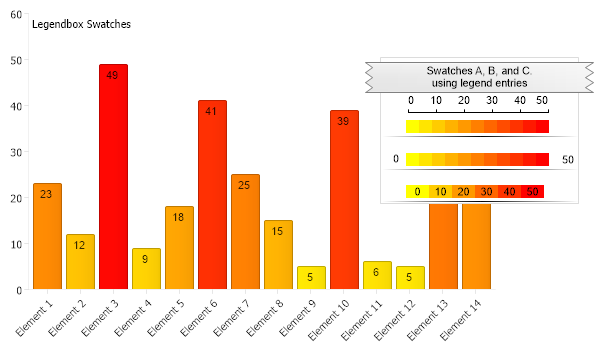
Color Swatch Legend
<%@ Page Language="C#" Description="dotnetCHARTING Component" %>
<%@ Register TagPrefix="dnc" Namespace="dotnetCHARTING" Assembly="dotnetCHARTING" %>
<%@ Import Namespace="System.Drawing" %>
<%@ Import Namespace="System.Drawing.Drawing2D" %>
<%@ Import Namespace="dotnetCHARTING.Mapping" %>
<script runat="server">
void Page_Load(Object sender, EventArgs e)
{
// Demonstrates generating and using color swatches in the legend box.
Chart.Size = "600x350";
Chart.ChartArea.Label.Text = "Legendbox Swatches";
Chart.TempDirectory = "temp";
Chart.Debug = true;
Chart.Type = ChartType.Combo;
Chart.MarginRight = 100;
Chart.ChartArea.ClearColors();
Chart.DefaultSeries.LegendEntry.Visible = false;
//Element labels
Chart.DefaultElement.ShowValue = true;
// *DYNAMIC DATA NOTE*
// This sample uses random data to populate the chart. To populate
// a chart with database data see the following resources:
// - Use the getLiveData() method using the dataEngine to query a database.
// - Help File > Getting Started > Data Tutorials
// - DataEngine Class in the help file
// - Sample: features/DataEngine.aspx
SeriesCollection mySC = getRandomData();
// Add the random data.
Chart.SeriesCollection.Add(mySC);
// Apply LegendBox styling settings.
Chart.LegendBox.Template = "%Value%Icon%Name";
Chart.LegendBox.Padding = 1;
Chart.LegendBox.Background.Color = Color.White;
Chart.LegendBox.DefaultCorner = BoxCorner.Square; ;
Chart.LegendBox.Position = new Point(380, 55);
Chart.LegendBox.Header.Label.Text = "Swatches A, B, and C. <br>using legend entries";
Chart.LegendBox.Header.StartCap = BoxCapStyle.Torn;
Chart.LegendBox.Header.EndCap = BoxCapStyle.Torn;
Chart.LegendBox.Header.Offset = new Point(0, 5);
Chart.LegendBox.Header.Background.ShadingEffectMode = ShadingEffectMode.Five;
// Setup SmartPalette
SmartColor sc2 = new SmartColor(Color.Yellow, Color.Red, new ScaleRange(0, 50));
Chart.SmartPalette.Add("*", sc2);
// Adjust smartPalette legend entry.
sc2.LegendEntry.Name = "50";
sc2.LegendEntry.Value = "0";
sc2.LegendEntry.CustomAttributes.Add("ICON", getSwatch(100, Chart.SmartPalette, 10, false));
sc2.LegendEntry.Name = "50";
sc2.LegendEntry.Value = "0 <block fColor='Transparent'>_";
sc2.LegendEntry.DividerLine.Color = Color.Black;
sc2.LegendEntry.PaddingTop = 12;
// Legend entry with microchart scale for the smartColor entry
LegendEntry LeScale = new LegendEntry();
LeScale.PaddingTop = 5;
LeScale.CustomAttributes.Add("ICON", "<Chart:Scale values='0,10,20,30,40,50' width='143'>");
LeScale.SortOrder = -2;
// Standalone swatch
LegendEntry LeSwatch = new LegendEntry();
LeSwatch.CustomAttributes.Add("ICON", getSwatch(100, Chart.SmartPalette, 10, false));
LeSwatch.SortOrder = -1;
LeSwatch.DividerLine.Color = Color.Black;
// Standalone swatch with values.
LegendEntry LeSwatchVals = new LegendEntry();
LeSwatchVals.CustomAttributes.Add("ICON", getSwatch(104, Chart.SmartPalette, 5, true));
LeSwatchVals.SortOrder = 2;
LeSwatchVals.PaddingTop = 12;
LeSwatchVals.DividerLine.Color = Color.Black;
// Add the new legend entries.
Chart.LegendBox.ExtraEntries.Add(LeScale, LeSwatch, LeSwatchVals);
}
string getSwatch(int width, SmartPalette sp, int divisions, bool withValues)
{
// Get Maximum Value of the smart palette range
double max = (double)sp.GetScaleRange("*").ValueHigh;
string swatch = "", spacers = "";
// Width of each division.
int boxWidth = width / divisions;
// Generate swatch string for each division.
for (int i = 0; i <= divisions; i++)
{
spacers += "<Chart:Spacer size='" + boxWidth + "x1'>";
// Get the color of the current division.
string color = getHTMLColor(sp.GetValueColor("", (i * (max / divisions))));
if (withValues)
swatch += "<block hAlignment='Center' bgColor='" + color + "'>" + (int)(i * (max / divisions));
else
swatch += "<block bgColor='" + color + "' fColor='" + color + "'>_";
}
//return the swatch string.
return spacers + "<row>" + swatch;
}
string getHTMLColor(Color c)
{
return "#" + c.R.ToString("X2") + c.G.ToString("X2") + c.B.ToString("X2");
}
SeriesCollection getRandomData()
{
Random myR = new Random(2);
SeriesCollection SC = new SeriesCollection();
for (int a = 1; a < 2; a++)
{
Series s = new Series("Series " + a.ToString());
int count = 5 + myR.Next(20);
for (int b = 1; b < 15; b++)
{
Element e = new Element("Element " + b.ToString());
e.YValue = 5 + myR.Next(45);
s.Elements.Add(e);
}
SC.Add(s);
}
return SC;
}
SeriesCollection getLiveData()
{
DataEngine de = new DataEngine(ConfigurationManager.AppSettings["DNCConnectionString"]);
de.ChartObject = Chart; // Necessary to view any errors the dataEngine may throw.
de.SqlStatement = "SELECT XAxisColumn, YAxisColumn FROM ....";
return de.GetSeries();
}
</script>
<html xmlns="http://www.w3.org/1999/xhtml">
<head>
<title>.netCHARTING Sample</title>
</head>
<body>
<div align="center">
<dnc:Chart ID="Chart" runat="server" />
</div>
<asp:Label ID="Label1" runat="server" />
</body>
</html>
<%@ Page Language="vb" Description="dotnetCHARTING Component" %>
<%@ Register TagPrefix="dnc" Namespace="dotnetCHARTING" Assembly="dotnetCHARTING" %>
<%@ Import Namespace="System.Drawing" %>
<%@ Import Namespace="System.Drawing.Drawing2D" %>
<%@ Import Namespace="dotnetCHARTING.Mapping" %>
<script runat="server">
Sub Page_Load(ByVal sender As Object, ByVal e As EventArgs)
' Demonstrates generating and using color swatches in the legend box.
Chart.Size = "600x350"
Chart.ChartArea.Label.Text = "Legendbox Swatches"
Chart.TempDirectory = "temp"
Chart.Debug = True
Chart.Type = ChartType.Combo
Chart.MarginRight = 100
Chart.ChartArea.ClearColors()
Chart.DefaultSeries.LegendEntry.Visible = False
'Element labels
Chart.DefaultElement.ShowValue = True
' *DYNAMIC DATA NOTE*
' This sample uses random data to populate the chart. To populate
' a chart with database data see the following resources:
' - Use the getLiveData() method using the dataEngine to query a database.
' - Help File > Getting Started > Data Tutorials
' - DataEngine Class in the help file
' - Sample: features/DataEngine.aspx
Dim mySC As SeriesCollection = getRandomData()
' Add the random data.
Chart.SeriesCollection.Add(mySC)
' Apply LegendBox styling settings.
Chart.LegendBox.Template = "%Value%Icon%Name"
Chart.LegendBox.Padding = 1
Chart.LegendBox.Background.Color = Color.White
Chart.LegendBox.DefaultCorner = BoxCorner.Square
Chart.LegendBox.Position = New Point(380, 55)
Chart.LegendBox.Header.Label.Text = "Swatches A, B, and C. <br>using legend entries"
Chart.LegendBox.Header.StartCap = BoxCapStyle.Torn
Chart.LegendBox.Header.EndCap = BoxCapStyle.Torn
Chart.LegendBox.Header.Offset = New Point(0, 5)
Chart.LegendBox.Header.Background.ShadingEffectMode = ShadingEffectMode.Five
' Setup SmartPalette
Dim sc2 As SmartColor = New SmartColor(Color.Yellow, Color.Red, New ScaleRange(0, 50))
Chart.SmartPalette.Add("*", sc2)
' Adjust smartPalette legend entry.
sc2.LegendEntry.Name = "50"
sc2.LegendEntry.Value = "0"
sc2.LegendEntry.CustomAttributes.Add("ICON", getSwatch(100, Chart.SmartPalette, 10, False))
sc2.LegendEntry.Name = "50"
sc2.LegendEntry.Value = "0 <block fColor='Transparent'>_"
sc2.LegendEntry.DividerLine.Color = Color.Black
sc2.LegendEntry.PaddingTop = 12
' Legend entry with microchart scale for the smartColor entry
Dim LeScale As LegendEntry = New LegendEntry()
LeScale.PaddingTop = 5
LeScale.CustomAttributes.Add("ICON", "<Chart:Scale values='0,10,20,30,40,50' width='143'>")
LeScale.SortOrder = -2
' Standalone swatch
Dim LeSwatch As LegendEntry = New LegendEntry()
LeSwatch.CustomAttributes.Add("ICON", getSwatch(100, Chart.SmartPalette, 10, False))
LeSwatch.SortOrder = -1
LeSwatch.DividerLine.Color = Color.Black
' Standalone swatch with values.
Dim LeSwatchVals As LegendEntry = New LegendEntry()
LeSwatchVals.CustomAttributes.Add("ICON", getSwatch(104, Chart.SmartPalette, 5, True))
LeSwatchVals.SortOrder = 2
LeSwatchVals.PaddingTop = 12
LeSwatchVals.DividerLine.Color = Color.Black
' Add the new legend entries.
Chart.LegendBox.ExtraEntries.Add(LeScale, LeSwatch, LeSwatchVals)
End Sub
Function getSwatch(ByVal width As Integer, ByVal sp As SmartPalette, ByVal divisions As Integer, ByVal withValues As Boolean) As String
' Get Maximum Value of the smart palette range
Dim max As Double = CDbl(sp.GetScaleRange("*").ValueHigh)
Dim swatch As String = "", spacers As String = ""
' Width of each division.
Dim boxWidth As Integer = width / divisions
' Generate swatch string for each division.
For i As Integer = 0 To divisions
spacers &= "<Chart:Spacer size='" & boxWidth & "x1'>"
' Get the color of the current division.
Dim color As String = getHTMLColor(sp.GetValueColor("", (i * (max / divisions))))
If withValues Then
swatch &= "<block hAlignment='Center' bgColor='" & color & "'>" & CInt(Fix(i * (max / divisions)))
Else
swatch &= "<block bgColor='" & color & "' fColor='" & color & "'>_"
End If
Next i
'return the swatch string.
Return spacers & "<row>" & swatch
End Function
Function getHTMLColor(ByVal c As Color) As String
Return "#" & c.R.ToString("X2") + c.G.ToString("X2") + c.B.ToString("X2")
End Function
Function getRandomData() As SeriesCollection
Dim myR As Random = New Random(2)
Dim SC As SeriesCollection = New SeriesCollection()
For a As Integer = 1 To 1
Dim s As Series = New Series("Series " & a.ToString())
Dim count As Integer = 5 + myR.Next(20)
For b As Integer = 1 To 14
Dim e As Element = New Element("Element " & b.ToString())
e.YValue = 5 + myR.Next(45)
s.Elements.Add(e)
Next b
SC.Add(s)
Next a
Return SC
End Function
Function getLiveData() As SeriesCollection
Dim de As DataEngine = New DataEngine(ConfigurationManager.AppSettings("DNCConnectionString"))
de.ChartObject = Chart ' Necessary to view any errors the dataEngine may throw.
de.SqlStatement = "SELECT XAxisColumn, YAxisColumn FROM ...."
Return de.GetSeries()
End Function
</script>
<html xmlns="http://www.w3.org/1999/xhtml">
<head>
<title>.netCHARTING Sample</title>
</head>
<body>
<div align="center">
<dnc:Chart ID="Chart" runat="server" />
</div>
<asp:Label ID="Label1" runat="server" />
</body>
</html>
- Sample FilenameColorSwatchLegend.aspx
- Version6.1
- Uses DatabaseNo