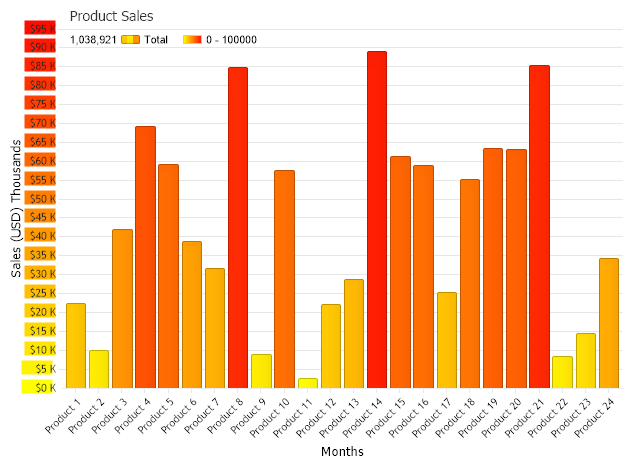
Axis Tick Swatch
Demonstrates using smartPalette using GetValueColor method with axis ticks.
<%@ Page Language="C#" Description="dotnetCHARTING Component" %>
<%@ Register TagPrefix="dnc" Namespace="dotnetCHARTING" Assembly="dotnetCHARTING" %>
<%@ Import Namespace="System.Drawing" %>
<script runat="server">
void Page_Load(Object sender, EventArgs e)
{
// Demonstrates using smartPalette using GetValueColor method with axis ticks.
//set global properties
Chart.DefaultSeries.ConnectionString = ConfigurationManager.AppSettings["DNCConnectionString"];
Chart.Title = "Product Sales";
Chart.XAxis.Label.Text = "Months";
Chart.TempDirectory = "temp";
Chart.Debug = true;
Chart.LegendBox.Position = LegendBoxPosition.ChartArea;
//Using a custom function to convert yAxis values
Chart.YAxis = Chart.YAxis.Calculate("Sales (USD) Thousands", new ChangeValueDelegate(MyFunction));
Chart.YAxis.Interval = 5000;
Chart.Series.StartDate = new DateTime(2022, 1, 1, 0, 0, 0);
Chart.Series.EndDate = new DateTime(2022, 12, 31, 23, 59, 59);
Chart.DateGrouping = TimeInterval.Year;
// Add some data.
Chart.SeriesCollection.Add(getRandomData());
// Define a range smart palette.
Chart.SmartPalette.Add("*", new SmartColor(Color.Yellow, Color.Red, new ScaleRange(0, 100000)));
}
public string MyFunction(string value)
{
double dValue = Convert.ToDouble(value);
string c = getHTMLColor(Chart.SmartPalette.GetValueColor("*", dValue));
dValue = dValue / 1000;
value = "<block bgColor='" + c + "'>quot; + Convert.ToString(dValue) + " K";
return value;
}
string getHTMLColor(Color c)
{
return "#" + c.R.ToString("X2") + c.G.ToString("X2") + c.B.ToString("X2");
}
SeriesCollection getRandomData()
{
Random myR = new Random(1);
SeriesCollection SC = new SeriesCollection();
for (int a = 1; a < 2; a++)
{
Series s = new Series("Total");
for (int b = 1; b < 25; b++)
{
Element e = new Element("Product " + b.ToString());
e.YValue = myR.Next(90000);
s.Elements.Add(e);
}
SC.Add(s);
}
return SC;
}
</script>
<html xmlns="http://www.w3.org/1999/xhtml">
<head>
<title>.netCHARTING Sample</title>
</head>
<body>
<div align="center">
<dnc:Chart ID="Chart" runat="server" />
</div>
</body>
</html>
<%@ Page Language="vb" Description="dotnetCHARTING Component" %>
<%@ Register TagPrefix="dnc" Namespace="dotnetCHARTING" Assembly="dotnetCHARTING" %>
<%@ Import Namespace="System.Drawing" %>
<script runat="server">
Sub Page_Load(ByVal sender As Object, ByVal e As EventArgs)
' Demonstrates using smartPalette using GetValueColor method with axis ticks.
'set global properties
Chart.DefaultSeries.ConnectionString = ConfigurationManager.AppSettings("DNCConnectionString")
Chart.Title = "Product Sales"
Chart.XAxis.Label.Text = "Months"
Chart.TempDirectory = "temp"
Chart.Debug = True
Chart.LegendBox.Position = LegendBoxPosition.ChartArea
'Using a custom function to convert yAxis values
Chart.YAxis = Chart.YAxis.Calculate("Sales (USD) Thousands", New ChangeValueDelegate(AddressOf MyFunction))
Chart.YAxis.Interval = 5000
Chart.Series.StartDate = New DateTime(2022, 1, 1, 0, 0, 0)
Chart.Series.EndDate = New DateTime(2022, 12, 31, 23, 59, 59)
Chart.DateGrouping = TimeInterval.Year
' Add some data.
Chart.SeriesCollection.Add(getRandomData())
' Define a range smart palette.
Chart.SmartPalette.Add("*", New SmartColor(Color.Yellow, Color.Red, New ScaleRange(0, 100000)))
End Sub
Public Function MyFunction(ByVal value As String) As String
Dim dValue As Double = Convert.ToDouble(value)
Dim c As String = getHTMLColor(Chart.SmartPalette.GetValueColor("*", dValue))
dValue = dValue / 1000
value = "<block bgColor='" & c & "'>quot; & Convert.ToString(dValue) & " K"
Return value
End Function
Function getHTMLColor(ByVal c As Color) As String
Return "#" & c.R.ToString("X2") + c.G.ToString("X2") + c.B.ToString("X2")
End Function
Function getRandomData() As SeriesCollection
Dim myR As Random = New Random(1)
Dim SC As SeriesCollection = New SeriesCollection()
For a As Integer = 1 To 1
Dim s As Series = New Series("Total")
For b As Integer = 1 To 24
Dim e As Element = New Element("Product " & b.ToString())
e.YValue = myR.Next(90000)
s.Elements.Add(e)
Next b
SC.Add(s)
Next a
Return SC
End Function
</script>
<html xmlns="http://www.w3.org/1999/xhtml">
<head>
<title>.netCHARTING Sample</title>
</head>
<body>
<div align="center">
<dnc:Chart ID="Chart" runat="server" />
</div>
</body>
</html>