Gallery
Annotation Data Source
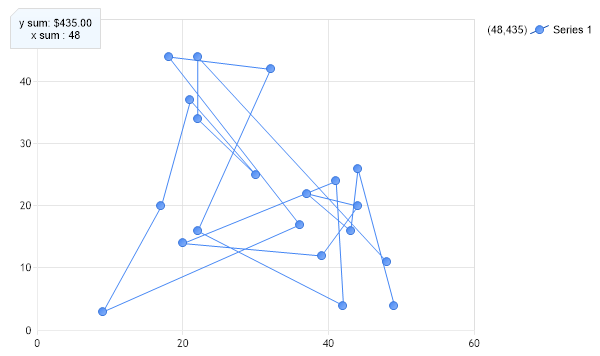
<%@ Page Language="C#" Description="dotnetCHARTING Component" %>
<%@ Register TagPrefix="dotnet" Namespace="dotnetCHARTING" Assembly="dotnetCHARTING"%>
<%@ Import Namespace="System.Drawing" %>
<html xmlns="http://www.w3.org/1999/xhtml">
<head>
<title>.netCHARTING Sample</title>
<script runat="server">
void Page_Load(Object sender,EventArgs e)
{
Chart.Type = ChartType.Combo;//Horizontal;
Chart.Width = 600;
Chart.Height = 350;
Chart.TempDirectory = "temp";
Chart.Debug = true;
Chart.DefaultSeries.Type = SeriesType.Line;
// Demonstrates how to use data sources to process string tokens in an annotation.
// It will take the series collection we chart and show some additional information about it in an annotation.
// 1. GET DATA
// *DYNAMIC DATA NOTE*
// This sample uses random data to populate the chart. For information on acquiring
// database data see the following resources:
// - Classic samples folder
// - Help File > Data Tutorials
// - Sample: features/DataEngine.aspx
SeriesCollection mySC = getRandomData();
// 2. CREATE AN ANNOTATION AND SET THE DATA SOURCE.
Annotation an = new Annotation();
// Create the data source.
an.DataSource = DataSource.FromSeriesCollection(mySC);
// A simpler way to set the data source that also works is to use
// the implicit casting functionality of the DataSource object.
an.DataSource = mySC;
// Specify the text with tokens to replace.
an.Label.Text = "y sum: <%YSum,Currency> \nx sum : %XSum";
an.Background.Color = Color.AliceBlue;
an.Padding = 8;
an.Size = new Size(90, 40);
// Add the annotation to the chart.
Chart.Annotations.Add(an);
// Add the random data.
Chart.SeriesCollection.Add(mySC);
}
SeriesCollection getRandomData()
{
SeriesCollection SC = new SeriesCollection();
Random myR = new Random();
for(int a = 1; a < 2; a++)
{
Series s = new Series();
s.Name = "Series " + a;
for(int b = 1; b < 21; b++)
{
Element e = new Element();
e.YValue = myR.Next(50);
e.XValue = myR.Next(50);
s.Elements.Add(e);
}
SC.Add(s);
}
return SC;
}
</script>
</head>
<body>
<div style="text-align:center">
<dotnet:Chart id="Chart" runat="server" Width="568px" Height="344px">
</dotnet:Chart>
</div>
</body>
</html>
<%@ Page Language="vb" Description="dotnetCHARTING Component" %>
<%@ Register TagPrefix="dotnet" Namespace="dotnetCHARTING" Assembly="dotnetCHARTING"%>
<%@ Import Namespace="System.Drawing" %>
<html xmlns="http://www.w3.org/1999/xhtml">
<head>
<title>.netCHARTING Sample</title>
<script runat="server">
Sub Page_Load(ByVal sender As Object, ByVal e As EventArgs)
Chart.Type = ChartType.Combo 'Horizontal;
Chart.Width = 600
Chart.Height = 350
Chart.TempDirectory = "temp"
Chart.Debug = True
Chart.DefaultSeries.Type = SeriesType.Line
' Demonstrates how to use data sources to process string tokens in an annotation.
' It will take the series collection we chart and show some additional information about it in an annotation.
' 1. GET DATA
' *DYNAMIC DATA NOTE*
' This sample uses random data to populate the chart. For information on acquiring
' database data see the following resources:
' - Classic samples folder
' - Help File > Data Tutorials
' - Sample: features/DataEngine.aspx
Dim mySC As SeriesCollection = getRandomData()
' 2. CREATE AN ANNOTATION AND SET THE DATA SOURCE.
Dim an As Annotation = New Annotation()
' Create the data source.
an.DataSource = DataSource.FromSeriesCollection(mySC)
' A simpler way to set the data source that also works is to use
' the implicit casting functionality of the DataSource object.
an.DataSource = mySC
' Specify the text with tokens to replace.
an.Label.Text = "y sum: <%YSum,Currency> " & Constants.vbLf & "x sum : %XSum"
an.Background.Color = Color.AliceBlue
an.Padding = 8
an.Size = New Size(90, 40)
' Add the annotation to the chart.
Chart.Annotations.Add(an)
' Add the random data.
Chart.SeriesCollection.Add(mySC)
End Sub
Function getRandomData() As SeriesCollection
Dim SC As SeriesCollection = New SeriesCollection()
Dim myR As Random = New Random()
For a As Integer = 1 To 1
Dim s As Series = New Series()
s.Name = "Series " & a
For b As Integer = 1 To 20
Dim e As Element = New Element()
e.YValue = myR.Next(50)
e.XValue = myR.Next(50)
s.Elements.Add(e)
Next b
SC.Add(s)
Next a
Return SC
End Function
</script>
</head>
<body>
<div style="text-align:center">
<dotnet:Chart id="Chart" runat="server" Width="568px" Height="344px">
</dotnet:Chart>
</div>
</body>
</html>
- Sample FilenameAnnotationDataSource.aspx
- VersionLegacy (Pre 3.0)
- Uses DatabaseNo