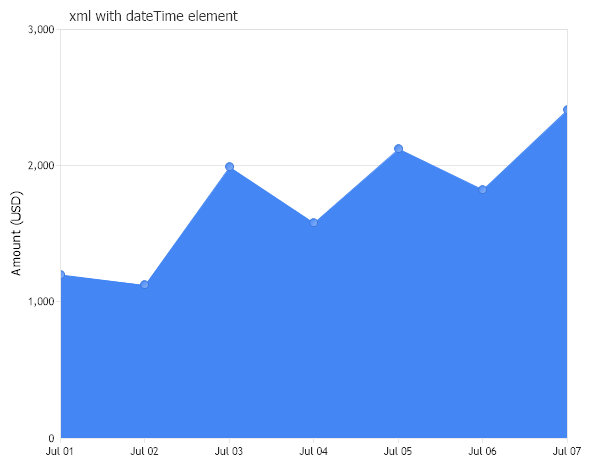
<%@ Page Language="C#" trace="false" Description="dotnetCHARTING Component"%><%@ Register TagPrefix="dotnet" Namespace="dotnetCHARTING" Assembly="dotnetCHARTING"%><%@ Import Namespace="System.Drawing" %><%@ Import Namespace="System.Data" %><%@ Import Namespace="System.Data.OleDb" %><script runat="server">void Page_Load(Object sender,EventArgs e){ //set Title Chart.Title="xml with dateTime element"; Chart.Type = ChartType.Combo; Chart.Size = "600x480"; Chart.TempDirectory = "temp" ; Chart.Debug = true; Chart.LegendBox.Visible = false; Chart.DefaultSeries.Type = SeriesType.AreaLine; Chart.XAxis.Scale = Scale.Time; Chart.XAxis.TimeInterval = TimeInterval.Day; Chart.XAxis.FormatString = "MMM dd"; // Set the y axis label Chart.ChartArea.YAxis.Label.Text="Amount (USD)"; Chart.Series.Name = "Sales"; Chart.Series.Data = "../../data/orders3.xml"; Chart.Series.DataFields = "Xvalue=date,yaxis=total"; Chart.SeriesCollection.Add(); }</script><html xmlns="http://www.w3.org/1999/xhtml"><head><title>XML Sample</title></head><body><div style="text-align:center"> <dotnet:Chart id="Chart" runat="server"/></div></body></html>
<%@ Page Language="vb" trace="false" Description="dotnetCHARTING Component"%><%@ Register TagPrefix="dotnet" Namespace="dotnetCHARTING" Assembly="dotnetCHARTING"%><%@ Import Namespace="System.Drawing" %><%@ Import Namespace="System.Data" %><%@ Import Namespace="System.Data.OleDb" %><script runat="server">Sub Page_Load(ByVal sender As Object, ByVal e As EventArgs) 'set Title Chart.Title="xml with dateTime element" Chart.Type = ChartType.Combo Chart.Size = "600x480" Chart.TempDirectory = "temp" Chart.Debug = True Chart.LegendBox.Visible = False Chart.DefaultSeries.Type = SeriesType.AreaLine Chart.XAxis.Scale = Scale.Time Chart.XAxis.TimeInterval = TimeInterval.Day Chart.XAxis.FormatString = "MMM dd" ' Set the y axis label Chart.ChartArea.YAxis.Label.Text="Amount (USD)" Chart.Series.Name = "Sales" Chart.Series.Data = "../../data/orders3.xml" Chart.Series.DataFields = "Xvalue=date,yaxis=total" Chart.SeriesCollection.Add()End Sub</script><html xmlns="http://www.w3.org/1999/xhtml"><head><title>XML Sample</title></head><body><div style="text-align:center"> <dotnet:Chart id="Chart" runat="server"/></div></body></html>