Gallery
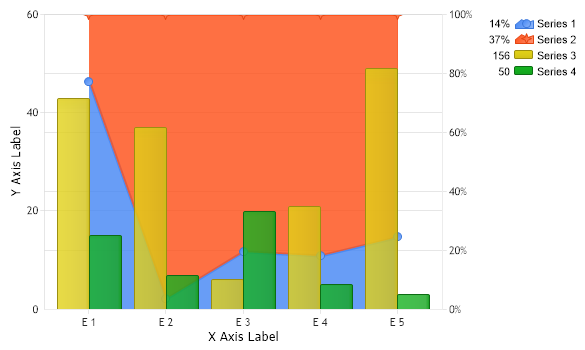
Stacked Full Column AreaLine
<%@ Page Language="C#" Description="dotnetCHARTING Component"%>
<%@ Register TagPrefix="dotnet" Namespace="dotnetCHARTING" Assembly="dotnetCHARTING"%>
<%@ Import Namespace="System.Drawing" %>
<%@ Import Namespace="System.Drawing.Drawing2D" %>
<script runat="server">
SeriesCollection getRandomData()
{
SeriesCollection SC = new SeriesCollection();
Random myR = new Random();
for(int a = 1; a < 5; a++)
{
Series s = new Series();
s.Name = "Series " + a;
for(int b = 1; b < 6; b++)
{
Element e = new Element();
e.Name = "E " + b;
e.YValue = myR.Next(50);
s.Elements.Add(e);
}
SC.Add(s);
}
// Set 2 series to bars and 2 to lines.
SC[0].Type = SeriesType.AreaLine;
SC[1].Type = SeriesType.AreaLine;
SC[2].Type = SeriesType.Column;
SC[3].Type = SeriesType.Column;
// Create a new axis with a full stacked scale for the area lines.
Axis axis = new Axis();
axis.Scale = Scale.FullStacked;
axis.Orientation = dotnetCHARTING.Orientation.Right;
SC[0].YAxis = axis;
SC[1].YAxis = axis;
return SC;
}
void Page_Load(Object sender,EventArgs e)
{
// Set the title.
//Chart.Title="My Chart";
// Set the Depth
Chart.Depth = 15;
// Set 3D
Chart.Use3D = false;
// set the x axis clustering
Chart.XAxis.ClusterColumns = false;
// Set a default transparency
Chart.DefaultSeries.DefaultElement.Transparency = 20;
// Set a default line Width
Chart.DefaultSeries.Line.Width = 3;
// Set the y Axis Scale
Chart.YAxis.Scale = Scale.Normal;
// Set the x axis label
Chart.XAxis.Label.Text="X Axis Label";
// Set the y axis label
Chart.YAxis.Label.Text="Y Axis Label";
// Set the directory where the images will be stored.
Chart.TempDirectory="temp";
// Set he chart size.
Chart.Width = 600;
Chart.Height = 350;
// Add the random data.
Chart.SeriesCollection.Add(getRandomData());
}
</script>
<html xmlns="http://www.w3.org/1999/xhtml"><head><title>Gallery Sample</title></head>
<body>
<div style="text-align:center">
<dotnet:Chart id="Chart" runat="server"/>
</div>
</body>
</html>
<%@ Page Language="vb" Description="dotnetCHARTING Component"%>
<%@ Register TagPrefix="dotnet" Namespace="dotnetCHARTING" Assembly="dotnetCHARTING"%>
<%@ Import Namespace="System.Drawing" %>
<%@ Import Namespace="System.Drawing.Drawing2D" %>
<script runat="server">
Function getRandomData() As SeriesCollection
Dim SC As SeriesCollection = New SeriesCollection()
Dim myR As Random = New Random()
For a As Integer = 1 To 4
Dim s As Series = New Series()
s.Name = "Series " & a
For b As Integer = 1 To 5
Dim e As Element = New Element()
e.Name = "E " & b
e.YValue = myR.Next(50)
s.Elements.Add(e)
Next b
SC.Add(s)
Next a
' Set 2 series to bars and 2 to lines.
SC(0).Type = SeriesType.AreaLine
SC(1).Type = SeriesType.AreaLine
SC(2).Type = SeriesType.Column
SC(3).Type = SeriesType.Column
' Create a new axis with a full stacked scale for the area lines.
Dim axis As Axis = New Axis()
axis.Scale = Scale.FullStacked
axis.Orientation = dotnetCHARTING.Orientation.Right
SC(0).YAxis = axis
SC(1).YAxis = axis
Return SC
End Function
Sub Page_Load(ByVal sender As Object, ByVal e As EventArgs)
' Set the title.
'Chart.Title="My Chart";
' Set the Depth
Chart.Depth = 15
' Set 3D
Chart.Use3D = False
' set the x axis clustering
Chart.XAxis.ClusterColumns = False
' Set a default transparency
Chart.DefaultSeries.DefaultElement.Transparency = 20
' Set a default line Width
Chart.DefaultSeries.Line.Width = 3
' Set the y Axis Scale
Chart.YAxis.Scale = Scale.Normal
' Set the x axis label
Chart.XAxis.Label.Text="X Axis Label"
' Set the y axis label
Chart.YAxis.Label.Text="Y Axis Label"
' Set the directory where the images will be stored.
Chart.TempDirectory="temp"
' Set he chart size.
Chart.Width = 600
Chart.Height = 350
' Add the random data.
Chart.SeriesCollection.Add(getRandomData())
End Sub
</script>
<html xmlns="http://www.w3.org/1999/xhtml"><head><title>Gallery Sample</title></head>
<body>
<div style="text-align:center">
<dotnet:Chart id="Chart" runat="server"/>
</div>
</body>
</html>
- Sample FilenameGallery/a53.aspx
- VersionLegacy (Pre 3.0)
- Uses DatabaseNo