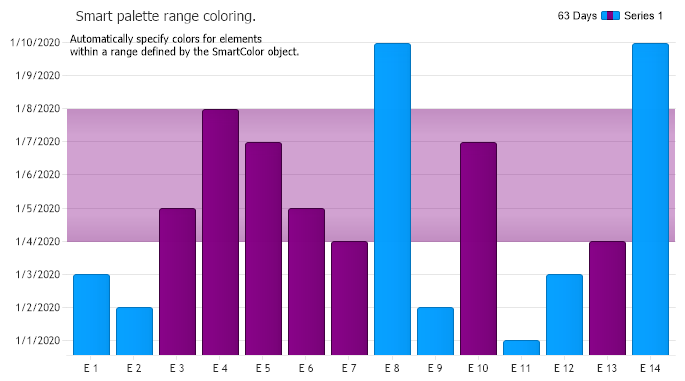
Smart Palette Date Range
Demonstrates how to use smart palettes to color elements with values within a specified range.
<%@ Page Language="C#" Description="dotnetCHARTING Component" %>
<%@ Register TagPrefix="dotnet" Namespace="dotnetCHARTING" Assembly="dotnetCHARTING"%>
<%@ Import Namespace="System.Drawing" %>
<%@ Import Namespace="System.Drawing.Drawing2D" %>
<html xmlns="http://www.w3.org/1999/xhtml">
<head>
<title>.netCHARTING Sample</title>
<script runat="server">
void Page_Load(Object sender,EventArgs e)
{
// Demonstrates how to use smart palettes to color elements with values within a specified range.
Chart.Type = ChartType.Combo;//Horizontal;
Chart.Size = "700x390";
Chart.TempDirectory = "temp";
Chart.Debug = true;
Chart.ChartArea.Label.Text = "Automatically specify colors for elements\nwithin a range defined by the SmartColor object.";
Chart.TitleBox.Label.Text="Smart palette range coloring.";
Chart.TitleBox.Position = TitleBoxPosition.FullWithLegend;
Chart.PaletteName = Palette.Default7;
Chart.MarginRight = 20;
Chart.YAxis.FormatString = "d";
// *DYNAMIC DATA NOTE*
// This sample uses random data to populate the chart. To populate
// a chart with database data see the following resources:
// - Classic samples folder
// - Help File > Data Tutorials
// - Sample: features/DataEngine.aspx
SeriesCollection mySC = getRandomData();
// Create smart palette.
SmartPalette sp = new SmartPalette();
// Create smart color with the range and color to use.
SmartColor sc = new SmartColor(Color.Purple, new ScaleRange(new DateTime(2020,1,4),new DateTime(2020,1,8)),ElementValue.YDateTime);
sc.LegendEntry.Visible = false;
// Add the color to the palette, and the palette to the chart.
sp.Add("Series 1", sc);
Chart.SmartPalette = sp;
Chart.YAxis.Markers.Add(new AxisMarker("",Color.FromArgb(100,Color.Purple),new DateTime(2020,1,4),new DateTime(2020,1,8)));
Chart.YAxis.Markers[0].LegendEntry.Visible = false;
// Add the random data.
Chart.SeriesCollection.Add(mySC);
}
SeriesCollection getRandomData()
{
SeriesCollection SC = new SeriesCollection();
Random myR = new Random(1);
for(int a = 1; a < 2; a++)
{
DateTime dt = new DateTime(2020,1,1);
Series s = new Series();
s.Name = "Series " + a.ToString();
for(int b = 1; b < 15; b++)
{
Element e = new Element();
e.Name = "E " + b.ToString();
e.YDateTime = dt.AddDays(myR.Next(10));
s.Elements.Add(e);
}
SC.Add(s);
}
return SC;
}
</script>
</head>
<body>
<div style="text-align:center">
<dotnet:Chart id="Chart" runat="server" >
</dotnet:Chart>
</div>
</body>
</html>
<%@ Page Language="vb" Description="dotnetCHARTING Component" %>
<%@ Register TagPrefix="dotnet" Namespace="dotnetCHARTING" Assembly="dotnetCHARTING"%>
<%@ Import Namespace="System.Drawing" %>
<%@ Import Namespace="System.Drawing.Drawing2D" %>
<html xmlns="http://www.w3.org/1999/xhtml">
<head>
<title>.netCHARTING Sample</title>
<script runat="server">
Sub Page_Load(ByVal sender As Object, ByVal e As EventArgs)
' Demonstrates how to use smart palettes to color elements with values within a specified range.
Chart.Type = ChartType.Combo 'Horizontal;
Chart.Size = "700x390"
Chart.TempDirectory = "temp"
Chart.Debug = True
Chart.ChartArea.Label.Text = "Automatically specify colors for elements" & Constants.vbLf & "within a range defined by the SmartColor object."
Chart.TitleBox.Label.Text="Smart palette range coloring."
Chart.TitleBox.Position = TitleBoxPosition.FullWithLegend
Chart.PaletteName = Palette.Default7
Chart.MarginRight = 20
Chart.YAxis.FormatString = "d"
' *DYNAMIC DATA NOTE*
' This sample uses random data to populate the chart. To populate
' a chart with database data see the following resources:
' - Classic samples folder
' - Help File > Data Tutorials
' - Sample: features/DataEngine.aspx
Dim mySC As SeriesCollection = getRandomData()
' Create smart palette.
Dim sp As SmartPalette = New SmartPalette()
' Create smart color with the range and color to use.
Dim sc As SmartColor = New SmartColor(Color.Purple, New ScaleRange(New DateTime(2020,1,4),New DateTime(2020,1,8)),ElementValue.YDateTime)
sc.LegendEntry.Visible = False
' Add the color to the palette, and the palette to the chart.
sp.Add("Series 1", sc)
Chart.SmartPalette = sp
Chart.YAxis.Markers.Add(New AxisMarker("",Color.FromArgb(100,Color.Purple),New DateTime(2020,1,4),New DateTime(2020,1,8)))
Chart.YAxis.Markers(0).LegendEntry.Visible = False
' Add the random data.
Chart.SeriesCollection.Add(mySC)
End Sub
Function getRandomData() As SeriesCollection
Dim SC As SeriesCollection = New SeriesCollection()
Dim myR As Random = New Random(1)
For a As Integer = 1 To 1
Dim dt As DateTime = New DateTime(2020,1,1)
Dim s As Series = New Series()
s.Name = "Series " & a.ToString()
For b As Integer = 1 To 14
Dim e As Element = New Element()
e.Name = "E " & b.ToString()
e.YDateTime = dt.AddDays(myR.Next(10))
s.Elements.Add(e)
Next b
SC.Add(s)
Next a
Return SC
End Function
</script>
</head>
<body>
<div style="text-align:center">
<dotnet:Chart id="Chart" runat="server" >
</dotnet:Chart>
</div>
</body>
</html>