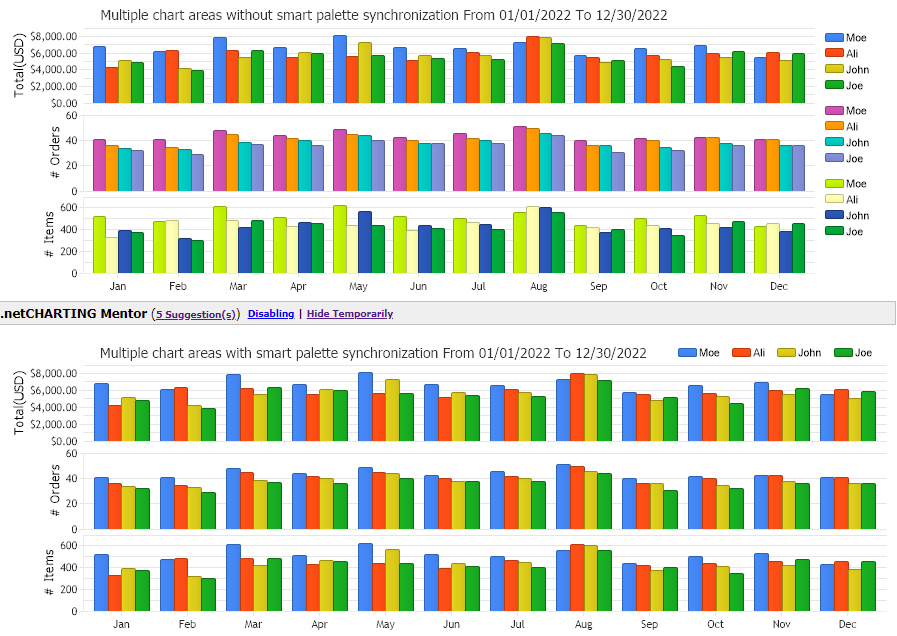
Smart Palette Auto Sync
Demonstrates the usage of color synchronization between multiple chart areas for the same elements.
<%@ Page Language="C#" Description="dotnetCHARTING Component" %>
<%@ Register TagPrefix="dotnet" Namespace="dotnetCHARTING" Assembly="dotnetCHARTING"%>
<%@ Import Namespace="System.Drawing" %>
<html xmlns="http://www.w3.org/1999/xhtml">
<head>
<title>.netCHARTING Sample</title>
<script runat="server">
void Page_Load(Object sender,EventArgs e)
{
//set global properties
Chart.Title="Multiple chart areas without smart palette synchronization";
Chart.SmartPaletteAutoSync = false;
Chart.Size = "850X310";
Chart.TempDirectory="temp";
Chart.Debug=true;
Chart.DefaultLegendBox.Template = "%Icon %Name";
Chart.YAxis.Label.Text = "Total(USD)";
Chart.YAxis.FormatString ="Currency";
//create a DataEngine to obtain data for two different series
DataEngine de = new DataEngine();
de.ChartObject = Chart;
de.DateGrouping =TimeInterval.Months;
de.ShowOther=false;
de.SplitByLimit = "4";
de.ConnectionString = ConfigurationManager.AppSettings["DNCConnectionString"];
de.StartDate=new DateTime (2022,1,1,0,0,0);
de.EndDate = new DateTime (2022,12,30,23,59,59);
de.SqlStatement= @"SELECT OrderDate, sum(Total),Name FROM Orders WHERE OrderDate >= #STARTDATE# AND OrderDate <= #ENDDATE# GROUP BY Orders.Name,OrderDate ORDER BY Orders.Name";
SeriesCollection sc = de.GetSeries();
Chart.SeriesCollection.Add(sc);
ChartArea ca2 = new ChartArea();
ca2.LegendBox = new LegendBox();
ca2.YAxis.Label.Text = "# Orders";
de.SqlStatement= @"SELECT OrderDate, sum(1),Name FROM Orders WHERE OrderDate >= #STARTDATE# AND OrderDate <= #ENDDATE# GROUP BY Orders.Name,OrderDate ORDER BY Orders.Name";
SeriesCollection sc2 = de.GetSeries();
ca2.SeriesCollection.Add(sc2);
// Add the new area to the chart.
Chart.ExtraChartAreas.Add(ca2);
ChartArea ca3 = new ChartArea();
ca3.LegendBox = new LegendBox();
ca3.YAxis.Label.Text = "# Items";
de.SqlStatement= @"SELECT OrderDate, sum(Quantity),Name FROM Orders WHERE OrderDate >= #STARTDATE# AND OrderDate <= #ENDDATE# GROUP BY Orders.Name,OrderDate ORDER BY Orders.Name";
SeriesCollection sc3 = de.GetSeries();
ca3.SeriesCollection.Add(sc3);
// Add the new area to the chart.
Chart.ExtraChartAreas.Add(ca3);
//set global properties
Chart2.Title="Multiple chart areas with smart palette synchronization";
Chart2.SmartPaletteAutoSync = true;
Chart2.Size = "900X310";
Chart2.TempDirectory="temp";
Chart2.Debug=true;
Chart2.DefaultLegendBox.Template = "%Icon %Name";
Chart2.TitleBox.Position = TitleBoxPosition.FullWithLegend;
Chart2.YAxis.Label.Text = "Total(USD)";
Chart2.YAxis.FormatString ="Currency";
de.ChartObject = Chart2;
de.SqlStatement= @"SELECT OrderDate, sum(Total),Name FROM Orders WHERE OrderDate >= #STARTDATE# AND OrderDate <= #ENDDATE# GROUP BY Orders.Name,OrderDate ORDER BY Orders.Name";
sc = de.GetSeries();
Chart2.SeriesCollection.Add(sc);
ca2 = new ChartArea();
ca2.LegendBox = new LegendBox();
ca2.LegendBox.Position = LegendBoxPosition.None;
ca2.YAxis.Label.Text = "# Orders";
de.SqlStatement= @"SELECT OrderDate, sum(1),Name FROM Orders WHERE OrderDate >= #STARTDATE# AND OrderDate <= #ENDDATE# GROUP BY Orders.Name,OrderDate ORDER BY Orders.Name";
sc2 = de.GetSeries();
ca2.SeriesCollection.Add(sc2);
// Add the new area to the chart2.
Chart2.ExtraChartAreas.Add(ca2);
ca3 = new ChartArea();
ca3.LegendBox = new LegendBox();
ca3.LegendBox.Position = LegendBoxPosition.None;
ca3.YAxis.Label.Text = "# Items";
de.SqlStatement= @"SELECT OrderDate, sum(Quantity),Name FROM Orders WHERE OrderDate >= #STARTDATE# AND OrderDate <= #ENDDATE# GROUP BY Orders.Name,OrderDate ORDER BY Orders.Name";
sc3 = de.GetSeries();
ca3.SeriesCollection.Add(sc3);
// Add the new area to the chart2.
Chart2.ExtraChartAreas.Add(ca3);
}
</script>
</head>
<body style="margin:auto;width:860px;">
<table><tr><td>
<dotnet:Chart id="Chart" runat="server">
</dotnet:Chart></td></tr><tr><td>
<dotnet:Chart id="Chart2" runat="server">
</dotnet:Chart>
</td></tr>
</table>
</body>
</html>
<%@ Page Language="vb" Description="dotnetCHARTING Component" %>
<%@ Register TagPrefix="dotnet" Namespace="dotnetCHARTING" Assembly="dotnetCHARTING"%>
<%@ Import Namespace="System.Drawing" %>
<html xmlns="http://www.w3.org/1999/xhtml">
<head>
<title>.netCHARTING Sample</title>
<script runat="server">
Sub Page_Load(ByVal sender As Object, ByVal e As EventArgs)
'set global properties
Chart.Title="Multiple chart areas without smart palette synchronization"
Chart.SmartPaletteAutoSync = False
Chart.Size = "850X310"
Chart.TempDirectory="temp"
Chart.Debug=True
Chart.DefaultLegendBox.Template = "%Icon %Name"
Chart.YAxis.Label.Text = "Total(USD)"
Chart.YAxis.FormatString ="Currency"
'create a DataEngine to obtain data for two different series
Dim de As DataEngine = New DataEngine()
de.ChartObject = Chart
de.DateGrouping =TimeInterval.Months
de.ShowOther=False
de.SplitByLimit = "4"
de.ConnectionString = ConfigurationManager.AppSettings("DNCConnectionString")
de.StartDate = New DateTime (2022,1,1,0,0,0)
de.EndDate = New DateTime (2022,12,30,23,59,59)
de.SqlStatement= "SELECT OrderDate, sum(Total),Name FROM Orders WHERE OrderDate >= #STARTDATE# AND OrderDate <= #ENDDATE# GROUP BY Orders.Name,OrderDate ORDER BY Orders.Name"
Dim sc As SeriesCollection = de.GetSeries()
Chart.SeriesCollection.Add(sc)
Dim ca2 As ChartArea = New ChartArea()
ca2.LegendBox = New LegendBox()
ca2.YAxis.Label.Text = "# Orders"
de.SqlStatement= "SELECT OrderDate, sum(1),Name FROM Orders WHERE OrderDate >= #STARTDATE# AND OrderDate <= #ENDDATE# GROUP BY Orders.Name,OrderDate ORDER BY Orders.Name"
Dim sc2 As SeriesCollection = de.GetSeries()
ca2.SeriesCollection.Add(sc2)
' Add the new area to the chart.
Chart.ExtraChartAreas.Add(ca2)
Dim ca3 As ChartArea = New ChartArea()
ca3.LegendBox = New LegendBox()
ca3.YAxis.Label.Text = "# Items"
de.SqlStatement= "SELECT OrderDate, sum(Quantity),Name FROM Orders WHERE OrderDate >= #STARTDATE# AND OrderDate <= #ENDDATE# GROUP BY Orders.Name,OrderDate ORDER BY Orders.Name"
Dim sc3 As SeriesCollection = de.GetSeries()
ca3.SeriesCollection.Add(sc3)
' Add the new area to the chart.
Chart.ExtraChartAreas.Add(ca3)
'set global properties
Chart2.Title="Multiple chart areas with smart palette synchronization"
Chart2.SmartPaletteAutoSync = True
Chart2.Size = "900X310"
Chart2.TempDirectory="temp"
Chart2.Debug=True
Chart2.DefaultLegendBox.Template = "%Icon %Name"
Chart2.TitleBox.Position = TitleBoxPosition.FullWithLegend
Chart2.YAxis.Label.Text = "Total(USD)"
Chart2.YAxis.FormatString ="Currency"
de.ChartObject = Chart2
de.SqlStatement= "SELECT OrderDate, sum(Total),Name FROM Orders WHERE OrderDate >= #STARTDATE# AND OrderDate <= #ENDDATE# GROUP BY Orders.Name,OrderDate ORDER BY Orders.Name"
sc = de.GetSeries()
Chart2.SeriesCollection.Add(sc)
ca2 = New ChartArea()
ca2.LegendBox = New LegendBox()
ca2.LegendBox.Position = LegendBoxPosition.None
ca2.YAxis.Label.Text = "# Orders"
de.SqlStatement= "SELECT OrderDate, sum(1),Name FROM Orders WHERE OrderDate >= #STARTDATE# AND OrderDate <= #ENDDATE# GROUP BY Orders.Name,OrderDate ORDER BY Orders.Name"
sc2 = de.GetSeries()
ca2.SeriesCollection.Add(sc2)
' Add the new area to the chart2.
Chart2.ExtraChartAreas.Add(ca2)
ca3 = New ChartArea()
ca3.LegendBox = New LegendBox()
ca3.LegendBox.Position = LegendBoxPosition.None
ca3.YAxis.Label.Text = "# Items"
de.SqlStatement= "SELECT OrderDate, sum(Quantity),Name FROM Orders WHERE OrderDate >= #STARTDATE# AND OrderDate <= #ENDDATE# GROUP BY Orders.Name,OrderDate ORDER BY Orders.Name"
sc3 = de.GetSeries()
ca3.SeriesCollection.Add(sc3)
' Add the new area to the chart2.
Chart2.ExtraChartAreas.Add(ca3)
End Sub
</script>
</head>
<body style="margin:auto;width:860px;">
<table><tr><td>
<dotnet:Chart id="Chart" runat="server">
</dotnet:Chart></td></tr><tr><td>
<dotnet:Chart id="Chart2" runat="server">
</dotnet:Chart>
</td></tr>
</table>
</body>
</html>