- JS Dot Plot Histogram
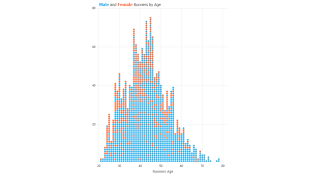
Demonstrates creating a dot plot histogram using the JavaScript chart.
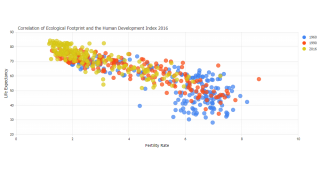
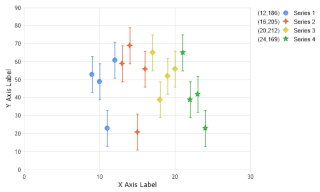
- JS Colorized Scatter
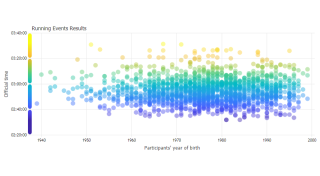
This sample domontrates a scatter chart with smartPalette axis line.
- JS USIndustries
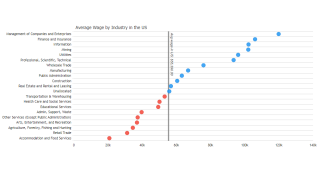
Demonstrates a marker chart loaded from csv data.
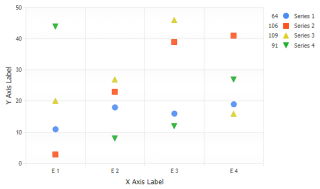
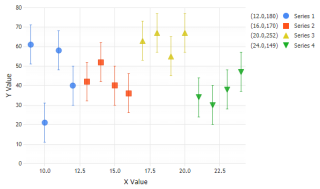
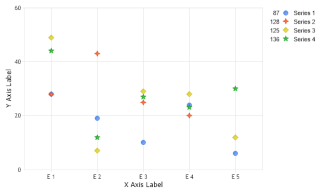
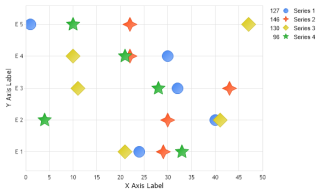
- JS Scatter Axis Markers
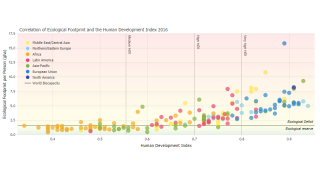
Demonstrates scatter chart with multiple series and axis markers with gradient color.
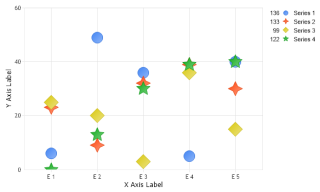
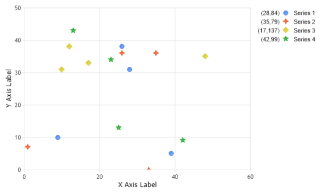
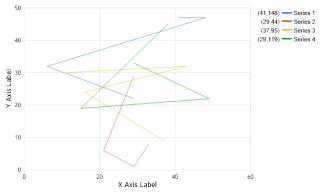
- JS Scatter Multi
Demonstrates scatter chart with multiple series and zooming.
- JS La Guardia Temps
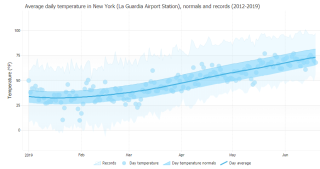
Demonstrates a styled scatter chart with overlaying area and line series.
- JS Version History
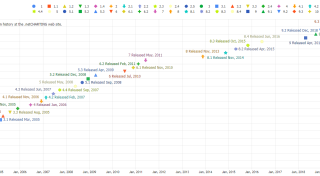
Demonstrates how to use database with JS scatter.
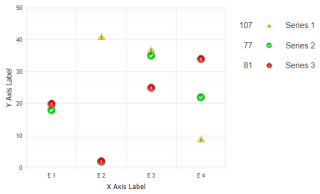
- JS Marker
Demonstrates a marker chart.
- JS IMarker
Demonstrates a image marker chart.
- JS Error Marker
Demonstrates error bars on markers.
- JS Horiz Marker
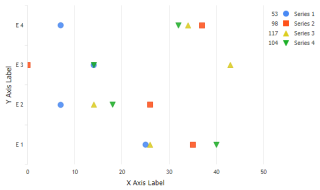
Demonstrates a marker chart.
- JS Horiz Error Marker
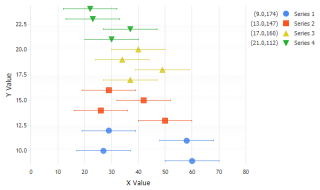
Demonstrates error bars on markers in a horizontal chart.
- Marker
Markers.
- LMarker
Large Markers.
- Error Marker
Markers with error bars.
- Marker Horiz
Markers.
- LMarker Horiz
Large Markers.
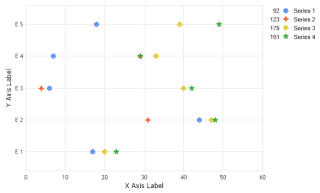
- Scatter Marker
Markers
- Scatter Line
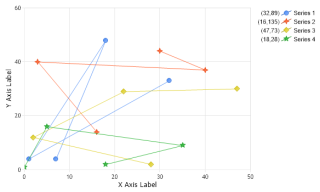
Lines
- Scatter Spline
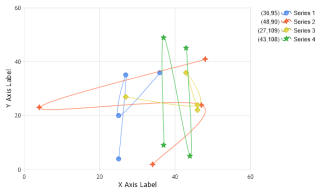
Splines
- Scatter Line Marker
Lines with no markers.
- Scatter Thick Lines Marker Dashed
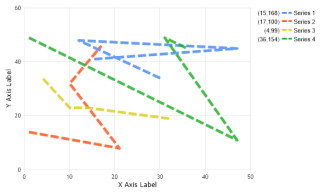
Thick line with a dash style and no markers.