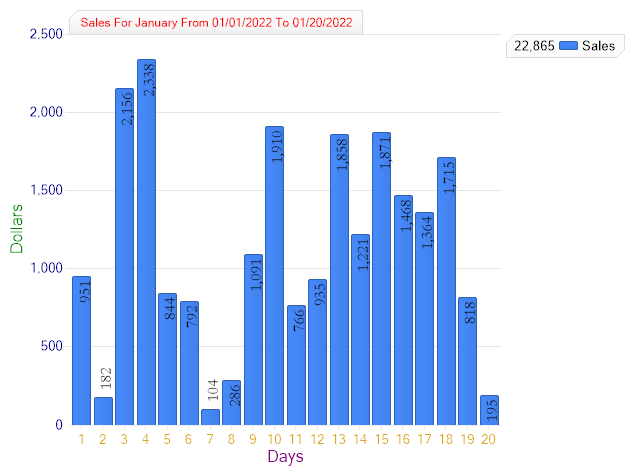
Sales 1
Sales of first 20 days of January 2002 by days. Label settings with font and color options.
<%@ Page Language="C#" Description="dotnetCHARTING Component"%>
<%@ Register TagPrefix="dotnet" Namespace="dotnetCHARTING" Assembly="dotnetCHARTING"%>
<%@ Import Namespace="System.Drawing" %>
<script runat="server">
void Page_Load(Object sender,EventArgs e)
{
//set global properties
Chart.DefaultSeries.ConnectionString = ConfigurationManager.AppSettings["DNCConnectionString"];
Chart.XAxis.FormatString ="%d";
Chart.TempDirectory="temp";
Chart.Debug=true;
Chart.DefaultSeries.StartDate=new System.DateTime(2022,1,1,0,0,0);
Chart.DefaultSeries.EndDate = new System.DateTime(2022,1,20,23,59,59);
Chart.DefaultSeries.DefaultElement.ShowValue=true;
Chart.DateGrouping = TimeInterval.Days;
Chart.TitleBox.Label = new dotnetCHARTING.Label("Sales For January",new Font("Bold Garamond",9),Color.Red);
Chart.LegendBox.LabelStyle.Font = new Font("Arial", 10);
Chart.LegendBox.LabelStyle.Color = Color.Black;
Chart.XAxis.Label = new dotnetCHARTING.Label("Days",new Font("Bold Garamond",12),Color.Purple);
Chart.YAxis.Label = new dotnetCHARTING.Label("Dollars",new Font("Bold Garamond",12),Color.Green);
Chart.ChartArea.DefaultElement.SmartLabel.Font = new Font("Garamond", 12);
Chart.ChartArea.DefaultElement.SmartLabel.Color = Color.Black;
Chart.XAxis.DefaultTick.Label.Font = new Font("Bold Garamond", 10);
Chart.XAxis.DefaultTick.Label.Color = Color.Goldenrod;
Chart.YAxis.DefaultTick.Label.Font = new Font("Bold Garamond", 10);
Chart.YAxis.DefaultTick.Label.Color = Color.DarkBlue;
//Add a series
Chart.Series.Name="Sales";
Chart.Series.SqlStatement= @"SELECT OrderDate,Total FROM Orders WHERE OrderDate >= #STARTDATE# AND OrderDate <= #ENDDATE# ORDER BY OrderDate";
Chart.SeriesCollection.Add();
}
</script>
<html xmlns="http://www.w3.org/1999/xhtml"><head><title>Sales Report</title></head>
<body>
<div style="text-align:center">
<dotnet:Chart id="Chart" runat="server"/>
</div>
</body>
</html>
<%@ Page Language="vb" Description="dotnetCHARTING Component"%>
<%@ Register TagPrefix="dotnet" Namespace="dotnetCHARTING" Assembly="dotnetCHARTING"%>
<%@ Import Namespace="System.Drawing" %>
<script runat="server">
Sub Page_Load(ByVal sender As Object, ByVal e As EventArgs)
'set global properties
Chart.DefaultSeries.ConnectionString = ConfigurationManager.AppSettings("DNCConnectionString")
Chart.XAxis.FormatString ="%d"
Chart.TempDirectory="temp"
Chart.Debug=True
Chart.DefaultSeries.StartDate = New System.DateTime(2022,1,1,0,0,0)
Chart.DefaultSeries.EndDate = New System.DateTime(2022,1,20,23,59,59)
Chart.DefaultSeries.DefaultElement.ShowValue=True
Chart.DateGrouping = TimeInterval.Days
Chart.TitleBox.Label = New dotnetCHARTING.Label("Sales For January",New Font("Bold Garamond",9),Color.Red)
Chart.LegendBox.LabelStyle.Font = New Font("Arial", 10)
Chart.LegendBox.LabelStyle.Color = Color.Black
Chart.XAxis.Label = New dotnetCHARTING.Label("Days",New Font("Bold Garamond",12),Color.Purple)
Chart.YAxis.Label = New dotnetCHARTING.Label("Dollars",New Font("Bold Garamond",12),Color.Green)
Chart.ChartArea.DefaultElement.SmartLabel.Font = New Font("Garamond", 12)
Chart.ChartArea.DefaultElement.SmartLabel.Color = Color.Black
Chart.XAxis.DefaultTick.Label.Font = New Font("Bold Garamond", 10)
Chart.XAxis.DefaultTick.Label.Color = Color.Goldenrod
Chart.YAxis.DefaultTick.Label.Font = New Font("Bold Garamond", 10)
Chart.YAxis.DefaultTick.Label.Color = Color.DarkBlue
'Add a series
Chart.Series.Name="Sales"
Chart.Series.SqlStatement= "SELECT OrderDate,Total FROM Orders WHERE OrderDate >= #STARTDATE# AND OrderDate <= #ENDDATE# ORDER BY OrderDate"
Chart.SeriesCollection.Add()
End Sub
</script>
<html xmlns="http://www.w3.org/1999/xhtml"><head><title>Sales Report</title></head>
<body>
<div style="text-align:center">
<dotnet:Chart id="Chart" runat="server"/>
</div>
</body>
</html>