Gallery
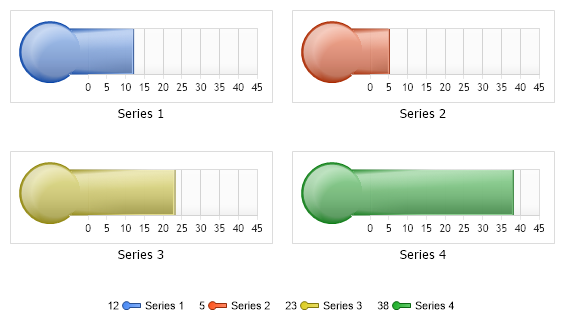
Metal Chrome HThermometers
<%@ Page Language="C#" Description="dotnetCHARTING Component" %>
<%@ Register TagPrefix="dotnet" Namespace="dotnetCHARTING" Assembly="dotnetCHARTING" %>
<%@ Import Namespace="System.Drawing" %>
<%@ Import Namespace="System.Drawing.Drawing2D" %>
<%@ Import Namespace="dotnetCHARTING.Mapping" %>
<script runat="server">
void Page_Load(Object sender, EventArgs e)
{
// Demonstrates linear horizontal gauges with shading effect mode seven.
Chart.TempDirectory = "temp";
Chart.Debug = true;
//Chart.LegacyMode = null;
//Chart.ChartArea.Line.Color = Color.Pink;
Chart.ShadingEffectMode = ShadingEffectMode.Seven;
Chart.Type = ChartType.Gauges;
Chart.DefaultSeries.GaugeType = GaugeType.Horizontal;
Chart.DefaultSeries.Type = GaugeType.Horizontal;
Chart.DefaultSeries.GaugeLinearStyle = GaugeLinearStyle.Thermometer;
Chart.DefaultSeries.Background.Color = Color.White;
Chart.Size = "600x350";
//Chart.Title = ".netCHARTING Sample";
Chart.YAxis.Line.Color = Color.LightGray;
//Chart.DefaultSeries.GaugeBorderBox.Line.Color = Color.Red;
//Chart.DefaultSeries.GaugeBorderBox.InteriorLine.Color = Color.Blue;
//or InteriorLine it seems like one of those should work.
// *DYNAMIC DATA NOTE*
// This sample uses random data to populate the chart. To populate
// a chart with database data see the following resources:
// - Help File > Getting Started > Data Tutorials
// - DataEngine Class in the help file
// - Sample: features/DataEngine.aspx
SeriesCollection mySC = getRandomData();
// Add the random data.
Chart.SeriesCollection.Add(mySC);
}
SeriesCollection getRandomData()
{
Random myR = new Random(1);
SeriesCollection SC = new SeriesCollection();
for (int a = 1; a < 5; a++)
{
Series s = new Series("Series " + a.ToString());
for (int b = 1; b < 2; b++)
{
Element e = new Element("Element " + b.ToString());
e.YValue = myR.Next(50);
s.Elements.Add(e);
}
SC.Add(s);
}
return SC;
}
SeriesCollection getLiveData()
{
DataEngine de = new DataEngine("ConnectionString goes here");
de.SqlStatement = "SELECT XAxisColumn, YAxisColumn FROM ....";
return de.GetSeries();
}
</script>
<html xmlns="http://www.w3.org/1999/xhtml">
<head>
<title>.netCHARTING Sample</title>
</head>
<body>
<div align="center">
<dotnet:Chart ID="Chart" runat="server" />
</div>
</body>
</html>
<%@ Page Language="vb" Description="dotnetCHARTING Component" %>
<%@ Register TagPrefix="dotnet" Namespace="dotnetCHARTING" Assembly="dotnetCHARTING" %>
<%@ Import Namespace="System.Drawing" %>
<%@ Import Namespace="System.Drawing.Drawing2D" %>
<%@ Import Namespace="dotnetCHARTING.Mapping" %>
<script runat="server">
Sub Page_Load(ByVal sender As Object, ByVal e As EventArgs)
' Demonstrates linear horizontal gauges with shading effect mode seven.
Chart.TempDirectory = "temp"
Chart.Debug = True
'Chart.LegacyMode = null;
'Chart.ChartArea.Line.Color = Color.Pink;
Chart.ShadingEffectMode = ShadingEffectMode.Seven
Chart.Type = ChartType.Gauges
Chart.DefaultSeries.GaugeType = GaugeType.Horizontal
Chart.DefaultSeries.Type = GaugeType.Horizontal
Chart.DefaultSeries.GaugeLinearStyle = GaugeLinearStyle.Thermometer
Chart.DefaultSeries.Background.Color = Color.White
Chart.Size = "600x350"
'Chart.Title = ".netCHARTING Sample";
Chart.YAxis.Line.Color = Color.LightGray
'Chart.DefaultSeries.GaugeBorderBox.Line.Color = Color.Red;
'Chart.DefaultSeries.GaugeBorderBox.InteriorLine.Color = Color.Blue;
'or InteriorLine it seems like one of those should work.
' *DYNAMIC DATA NOTE*
' This sample uses random data to populate the chart. To populate
' a chart with database data see the following resources:
' - Help File > Getting Started > Data Tutorials
' - DataEngine Class in the help file
' - Sample: features/DataEngine.aspx
Dim mySC As SeriesCollection = getRandomData()
' Add the random data.
Chart.SeriesCollection.Add(mySC)
End Sub
Function getRandomData() As SeriesCollection
Dim myR As Random = New Random(1)
Dim SC As SeriesCollection = New SeriesCollection()
For a As Integer = 1 To 4
Dim s As Series = New Series("Series " & a.ToString())
For b As Integer = 1 To 1
Dim e As Element = New Element("Element " & b.ToString())
e.YValue = myR.Next(50)
s.Elements.Add(e)
Next b
SC.Add(s)
Next a
Return SC
End Function
Function getLiveData() As SeriesCollection
Dim de As DataEngine = New DataEngine("ConnectionString goes here")
de.SqlStatement = "SELECT XAxisColumn, YAxisColumn FROM ...."
Return de.GetSeries()
End Function
</script>
<html xmlns="http://www.w3.org/1999/xhtml">
<head>
<title>.netCHARTING Sample</title>
</head>
<body>
<div align="center">
<dotnet:Chart ID="Chart" runat="server" />
</div>
</body>
</html>
- Sample FilenameGallery/h06402.aspx
- Version5.0
- Uses DatabaseNo