Gallery
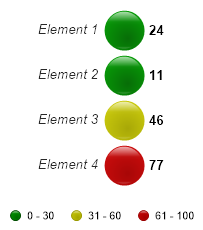
Shaded Gauge Indicator
<%@ Page Language="C#" Description="dotnetCHARTING Component" %>
<%@ Register TagPrefix="dotnet" Namespace="dotnetCHARTING" Assembly="dotnetCHARTING" %>
<%@ Import Namespace="System.Drawing" %>
<%@ Import Namespace="System.Drawing.Drawing2D" %>
<%@ Import Namespace="dotnetCHARTING.Mapping" %>
<script runat="server">
void Page_Load(Object sender, EventArgs e)
{
// Demonstrates gauge indicator lights with shading effect mode one.
Chart.TempDirectory = "temp";
Chart.Debug = true;
Chart.Type = ChartType.Gauges;
Chart.DefaultSeries.GaugeType = GaugeType.IndicatorLight;
Chart.Size = "210x240";
Chart.ShadingEffectMode = ShadingEffectMode.One;
Chart.Margin = "0";
Chart.DefaultElement.Marker.Size = 40;
Chart.ChartArea.ClearColors();
Chart.ChartArea.Padding = 0;
Chart.LegendBox.Template = "%Icon%Name";
Chart.LegendBox.Position = LegendBoxPosition.BottomMiddle;
// *DYNAMIC DATA NOTE*
// This sample uses random data to populate the chart. To populate
// a chart with database data see the following resources:
// - Help File > Getting Started > Data Tutorials
// - DataEngine Class in the help file
// - Sample: features/DataEngine.aspx
// Create smart palette.
SmartPalette sp = new SmartPalette();
Chart.SmartPalette = sp;
// Create smart color with the range and color to use.
SmartColor sc = new SmartColor(Color.Green, new ScaleRange(0, 30));
SmartColor sc2 = new SmartColor(Color.Yellow, new ScaleRange(31, 60));
SmartColor sc3 = new SmartColor(Color.Red, new ScaleRange(61, 100));
// Add the color to the palette, and the palette to the chart.
sp.Add("*", sc);
sp.Add("*", sc2);
sp.Add("*", sc3);
Chart.DefaultSeries.Background.Color = Color.White;
Chart.DefaultElement.SmartLabel.Color = Color.Black;
Chart.XAxis.DefaultTick.Label.Font = new Font("Arial", 10, FontStyle.Italic);
Chart.DefaultElement.SmartLabel.Alignment = LabelAlignment.OutsideTop;
Chart.DefaultElement.SmartLabel.Font = new Font("Arial", 10, FontStyle.Bold);
SeriesCollection mySC = getRandomData();
// Add the random data.
Chart.SeriesCollection.Add(mySC);
}
SeriesCollection getRandomData()
{
Random myR = new Random(1);
SeriesCollection SC = new SeriesCollection();
for (int a = 1; a < 2; a++)
{
Series s = new Series("");
s.LegendEntry.Visible = false;
for (int b = 1; b < 5; b++)
{
Element e = new Element("Element " + b.ToString());
e.YValue = myR.Next(100);
s.Elements.Add(e);
}
SC.Add(s);
}
return SC;
}
SeriesCollection getLiveData()
{
DataEngine de = new DataEngine("ConnectionString goes here");
de.SqlStatement = "SELECT XAxisColumn, YAxisColumn FROM ....";
return de.GetSeries();
}
</script>
<html xmlns="http://www.w3.org/1999/xhtml">
<head>
<title>.netCHARTING Sample</title>
</head>
<body>
<div align="center">
<dotnet:Chart ID="Chart" runat="server" />
</div>
</body>
</html>
<%@ Page Language="vb" Description="dotnetCHARTING Component" %>
<%@ Register TagPrefix="dotnet" Namespace="dotnetCHARTING" Assembly="dotnetCHARTING" %>
<%@ Import Namespace="System.Drawing" %>
<%@ Import Namespace="System.Drawing.Drawing2D" %>
<%@ Import Namespace="dotnetCHARTING.Mapping" %>
<script runat="server">
Sub Page_Load(ByVal sender As Object, ByVal e As EventArgs)
' Demonstrates gauge indicator lights with shading effect mode one.
Chart.TempDirectory = "temp"
Chart.Debug = True
Chart.Type = ChartType.Gauges
Chart.DefaultSeries.GaugeType = GaugeType.IndicatorLight
Chart.Size = "210x240"
Chart.ShadingEffectMode = ShadingEffectMode.One
Chart.Margin = "0"
Chart.DefaultElement.Marker.Size = 40
Chart.ChartArea.ClearColors()
Chart.ChartArea.Padding = 0
Chart.LegendBox.Template = "%Icon%Name"
Chart.LegendBox.Position = LegendBoxPosition.BottomMiddle
' *DYNAMIC DATA NOTE*
' This sample uses random data to populate the chart. To populate
' a chart with database data see the following resources:
' - Help File > Getting Started > Data Tutorials
' - DataEngine Class in the help file
' - Sample: features/DataEngine.aspx
' Create smart palette.
Dim sp As SmartPalette = New SmartPalette()
Chart.SmartPalette = sp
' Create smart color with the range and color to use.
Dim sc As SmartColor = New SmartColor(Color.Green, New ScaleRange(0, 30))
Dim sc2 As SmartColor = New SmartColor(Color.Yellow, New ScaleRange(31, 60))
Dim sc3 As SmartColor = New SmartColor(Color.Red, New ScaleRange(61, 100))
' Add the color to the palette, and the palette to the chart.
sp.Add("*", sc)
sp.Add("*", sc2)
sp.Add("*", sc3)
Chart.DefaultSeries.Background.Color = Color.White
Chart.DefaultElement.SmartLabel.Color = Color.Black
Chart.XAxis.DefaultTick.Label.Font = New Font("Arial", 10, FontStyle.Italic)
Chart.DefaultElement.SmartLabel.Alignment = LabelAlignment.OutsideTop
Chart.DefaultElement.SmartLabel.Font = New Font("Arial", 10, FontStyle.Bold)
Dim mySC As SeriesCollection = getRandomData()
' Add the random data.
Chart.SeriesCollection.Add(mySC)
End Sub
Function getRandomData() As SeriesCollection
Dim myR As Random = New Random(1)
Dim SC As SeriesCollection = New SeriesCollection()
For a As Integer = 1 To 1
Dim s As Series = New Series("")
s.LegendEntry.Visible = False
For b As Integer = 1 To 4
Dim e As Element = New Element("Element " & b.ToString())
e.YValue = myR.Next(100)
s.Elements.Add(e)
Next b
SC.Add(s)
Next a
Return SC
End Function
Function getLiveData() As SeriesCollection
Dim de As DataEngine = New DataEngine("ConnectionString goes here")
de.SqlStatement = "SELECT XAxisColumn, YAxisColumn FROM ...."
Return de.GetSeries()
End Function
</script>
<html xmlns="http://www.w3.org/1999/xhtml">
<head>
<title>.netCHARTING Sample</title>
</head>
<body>
<div align="center">
<dotnet:Chart ID="Chart" runat="server" />
</div>
</body>
</html>
- Sample FilenameGallery/h015.aspx
- Version4.3
- Uses DatabaseNo