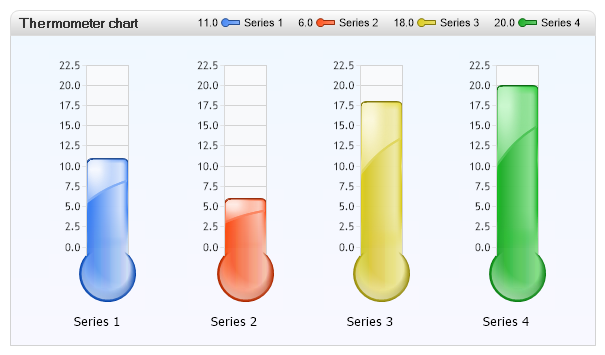
Gallery
Candy VThermometers
<%@ Page Language="C#" Description="dotnetCHARTING Component" %>
<%@ Register TagPrefix="dotnet" Namespace="dotnetCHARTING" Assembly="dotnetCHARTING"%>
<%@ Import Namespace="System.Drawing" %>
<script runat="server">
void Page_Load(Object sender,EventArgs e)
{
// Demonstrates vertical thermometer gauges using ShadingEffect.
Chart.TempDirectory = "temp";
Chart.Debug = true;
// TitleBox Customization
Chart.TitleBox.Position = TitleBoxPosition.FullWithLegend;
Chart.TitleBox.Background = new Background(Color.White,Color.LightGray,90);
Chart.TitleBox.Label.OutlineColor = Color.LightGray;
Chart.TitleBox.CornerTopLeft = BoxCorner.Round;
Chart.TitleBox.CornerTopRight = BoxCorner.Round;
Chart.ChartArea.Background = new Background(Color.AliceBlue,Color.GhostWhite,90);
Chart.ChartArea.Line = new Line(Color.LightGray, 1);
Chart.DefaultSeries.GaugeBorderBox.Line = new Line(Color.Transparent, 0);
Chart.DefaultChartArea.Line = new Line(Color.LightGray, 1);
Chart.Type = ChartType.Gauges;
Chart.DefaultSeries.GaugeType = GaugeType.Vertical;
Chart.DefaultSeries.Type = GaugeType.Vertical;
Chart.DefaultSeries.GaugeLinearStyle = GaugeLinearStyle.Thermometer;
Chart.Size = "600x350";
Chart.TitleBox.Label.Text = "Thermometer chart";
Chart.TitleBox.Label.Font = new Font("tahoma, geneva, sans-serif", 10, FontStyle.Bold);
Chart.ShadingEffectMode = ShadingEffectMode.Four;
Chart.DefaultSeries.Background = new Background(Color.AliceBlue,Color.GhostWhite,90);//.Color = Color.White;
// *DYNAMIC DATA NOTE*
// This sample uses random data to populate the chart. To populate
// a chart with database data see the following resources:
// - Help File > Getting Started > Data Tutorials
// - DataEngine Class in the help file
// - Sample: features/DataEngine.aspx
SeriesCollection mySC = getRandomData();
// Add the random data.
Chart.SeriesCollection.Add(mySC);
}
SeriesCollection getRandomData()
{
Random myR = new Random();
SeriesCollection SC = new SeriesCollection();
for(int a = 1; a < 5; a++)
{
Series s = new Series("Series " + a.ToString());
Element e = new Element("Element");
e.YValue = myR.Next(50);
s.Elements.Add(e);
SC.Add(s);
}
return SC;
}
</script>
<html xmlns="http://www.w3.org/1999/xhtml">
<head><title>.netCHARTING Sample</title></head>
<body>
<div align="center">
<dotnet:Chart id="Chart" runat="server"/>
</div>
</body>
</html>
<%@ Page Language="vb" Description="dotnetCHARTING Component" %>
<%@ Register TagPrefix="dotnet" Namespace="dotnetCHARTING" Assembly="dotnetCHARTING"%>
<%@ Import Namespace="System.Drawing" %>
<script runat="server">
Sub Page_Load(ByVal sender As Object, ByVal e As EventArgs)
' Demonstrates vertical thermometer gauges using ShadingEffect.
Chart.TempDirectory = "temp"
Chart.Debug = True
' TitleBox Customization
Chart.TitleBox.Position = TitleBoxPosition.FullWithLegend
Chart.TitleBox.Background = New Background(Color.White,Color.LightGray,90)
Chart.TitleBox.Label.OutlineColor = Color.LightGray
Chart.TitleBox.CornerTopLeft = BoxCorner.Round
Chart.TitleBox.CornerTopRight = BoxCorner.Round
Chart.ChartArea.Background = New Background(Color.AliceBlue,Color.GhostWhite,90)
Chart.ChartArea.Line = New Line(Color.LightGray, 1)
Chart.DefaultSeries.GaugeBorderBox.Line = New Line(Color.Transparent, 0)
Chart.DefaultChartArea.Line = New Line(Color.LightGray, 1)
Chart.Type = ChartType.Gauges
Chart.DefaultSeries.GaugeType = GaugeType.Vertical
Chart.DefaultSeries.Type = GaugeType.Vertical
Chart.DefaultSeries.GaugeLinearStyle = GaugeLinearStyle.Thermometer
Chart.Size = "600x350"
Chart.TitleBox.Label.Text = "Thermometer chart"
Chart.TitleBox.Label.Font = New Font("tahoma, geneva, sans-serif", 10, FontStyle.Bold)
Chart.ShadingEffectMode = ShadingEffectMode.Four
Chart.DefaultSeries.Background = New Background(Color.AliceBlue,Color.GhostWhite,90) '.Color = Color.White;
' *DYNAMIC DATA NOTE*
' This sample uses random data to populate the chart. To populate
' a chart with database data see the following resources:
' - Help File > Getting Started > Data Tutorials
' - DataEngine Class in the help file
' - Sample: features/DataEngine.aspx
Dim mySC As SeriesCollection = getRandomData()
' Add the random data.
Chart.SeriesCollection.Add(mySC)
End Sub
Function getRandomData() As SeriesCollection
Dim myR As Random = New Random()
Dim SC As SeriesCollection = New SeriesCollection()
For a As Integer = 1 To 4
Dim s As Series = New Series("Series " & a.ToString())
Dim e As Element = New Element("Element")
e.YValue = myR.Next(50)
s.Elements.Add(e)
SC.Add(s)
Next a
Return SC
End Function
</script>
<html xmlns="http://www.w3.org/1999/xhtml">
<head><title>.netCHARTING Sample</title></head>
<body>
<div align="center">
<dotnet:Chart id="Chart" runat="server"/>
</div>
</body>
</html>
- Sample FilenameGallery/h045.aspx
- Version4.3
- Uses DatabaseNo