Gallery
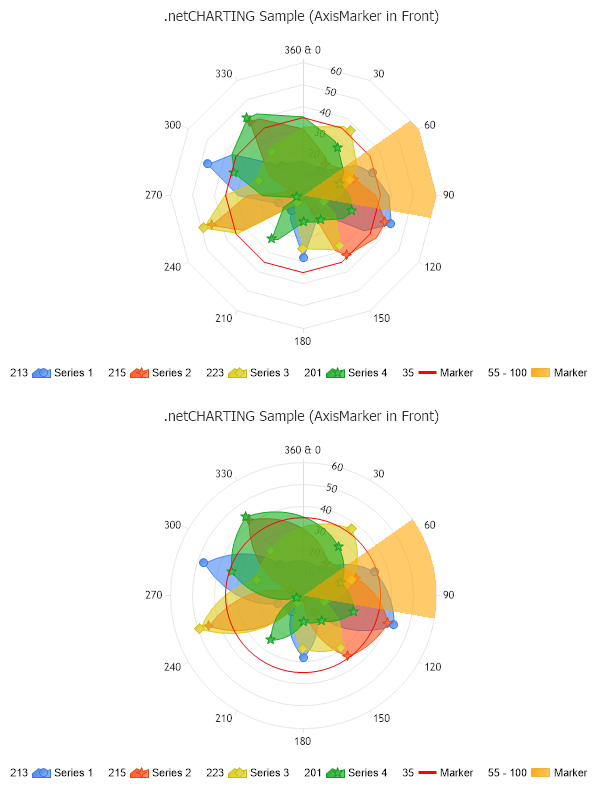
Radar Markers In Front
<%@ Page Language="C#" Description="dotnetCHARTING Component" %>
<%@ Register TagPrefix="dotnet" Namespace="dotnetCHARTING" Assembly="dotnetCHARTING"%>
<%@ Import Namespace="System.Drawing" %>
<%@ Import Namespace="System.Drawing.Drawing2D" %>
<html xmlns="http://www.w3.org/1999/xhtml">
<head>
<title>.netCHARTING Sample</title>
<script runat="server">
void Page_Load(Object sender,EventArgs e)
{
// Demonstrates using axis markers with polar and spider radar charts.
// Specify RadarMode
Chart.XAxis.RadarMode = RadarMode.Spider;
Chart1.XAxis.RadarMode = RadarMode.Polar;
// Add axis markers.
AxisMarker a1 = new AxisMarker("Marker",Color.Red,35);
AxisMarker a2 = new AxisMarker("Marker",Color.Red,35);
AxisMarker a3 = new AxisMarker("Marker",Color.FromArgb(150,Color.Orange),55,100);
AxisMarker a4 = new AxisMarker("Marker",Color.FromArgb(150,Color.Orange),55,100);
a1.BringToFront = true;
a2.BringToFront = true;
a3.BringToFront = true;
a4.BringToFront = true;
Chart.YAxis.Markers.Add(a1);
Chart1.YAxis.Markers.Add(a2);
Chart.XAxis.Markers.Add(a3);
Chart1.XAxis.Markers.Add(a4);
// Setup the two charts.
Chart.Type = ChartType.Radar;//Horizontal;
Chart.Size = "650x400";
Chart.TempDirectory = "temp";
Chart.Debug = true;
Chart.TitleBox.Label.Text = ".netCHARTING Sample (AxisMarker in Front)";
Chart.TitleBox.Position = TitleBoxPosition.Center;
Chart1.Type = ChartType.Radar;//Horizontal;
Chart1.Size = "650x400";
Chart1.TempDirectory = "temp";
Chart1.Debug = true;
Chart1.TitleBox.Label.Text = ".netCHARTING Sample (AxisMarker in Front)";
Chart1.TitleBox.Position = TitleBoxPosition.Center;
// *DYNAMIC DATA NOTE*
// This sample uses random data to populate the chart. To populate
// a chart with database data see the following resources:
// - Classic samples folder
// - Help File > Data Tutorials
// - Sample: features/DataEngine.aspx
SeriesCollection mySC = getRandomData();
// Add the random data.
Chart.SeriesCollection.Add(mySC);
Chart1.SeriesCollection.Add(getRandomData());
}
SeriesCollection getRandomData()
{
SeriesCollection SC = new SeriesCollection();
Random myR = new Random(3);
for(int a = 1; a < 5; a++)
{
Series s = new Series();
s.Name = "Series " + a.ToString();
for(int b = 1; b < 10; b++)
{
Element e = new Element();
e.YValue = myR.Next(50);
e.XValue = (360/10)*b ;
s.Elements.Add(e);
}
SC.Add(s);
}
return SC;
}
</script>
</head>
<body>
<div style="text-align:center">
<dotnet:Chart id="Chart" runat="server" Width="568px" Height="344px">
</dotnet:Chart>
<dotnet:Chart id="Chart1" runat="server" Width="568px" Height="344px">
</dotnet:Chart>
</div>
</body>
</html>
<%@ Page Language="vb" Description="dotnetCHARTING Component" %>
<%@ Register TagPrefix="dotnet" Namespace="dotnetCHARTING" Assembly="dotnetCHARTING"%>
<%@ Import Namespace="System.Drawing" %>
<%@ Import Namespace="System.Drawing.Drawing2D" %>
<html xmlns="http://www.w3.org/1999/xhtml">
<head>
<title>.netCHARTING Sample</title>
<script runat="server">
Sub Page_Load(ByVal sender As Object, ByVal e As EventArgs)
' Demonstrates using axis markers with polar and spider radar charts.
' Specify RadarMode
Chart.XAxis.RadarMode = RadarMode.Spider
Chart1.XAxis.RadarMode = RadarMode.Polar
' Add axis markers.
Dim a1 As AxisMarker = New AxisMarker("Marker",Color.Red,35)
Dim a2 As AxisMarker = New AxisMarker("Marker",Color.Red,35)
Dim a3 As AxisMarker = New AxisMarker("Marker",Color.FromArgb(150,Color.Orange),55,100)
Dim a4 As AxisMarker = New AxisMarker("Marker",Color.FromArgb(150,Color.Orange),55,100)
a1.BringToFront = True
a2.BringToFront = True
a3.BringToFront = True
a4.BringToFront = True
Chart.YAxis.Markers.Add(a1)
Chart1.YAxis.Markers.Add(a2)
Chart.XAxis.Markers.Add(a3)
Chart1.XAxis.Markers.Add(a4)
' Setup the two charts.
Chart.Type = ChartType.Radar 'Horizontal;
Chart.Size = "650x400"
Chart.TempDirectory = "temp"
Chart.Debug = True
Chart.TitleBox.Label.Text = ".netCHARTING Sample (AxisMarker in Front)"
Chart.TitleBox.Position = TitleBoxPosition.Center
Chart1.Type = ChartType.Radar 'Horizontal;
Chart1.Size = "650x400"
Chart1.TempDirectory = "temp"
Chart1.Debug = True
Chart1.TitleBox.Label.Text = ".netCHARTING Sample (AxisMarker in Front)"
Chart1.TitleBox.Position = TitleBoxPosition.Center
' *DYNAMIC DATA NOTE*
' This sample uses random data to populate the chart. To populate
' a chart with database data see the following resources:
' - Classic samples folder
' - Help File > Data Tutorials
' - Sample: features/DataEngine.aspx
Dim mySC As SeriesCollection = getRandomData()
' Add the random data.
Chart.SeriesCollection.Add(mySC)
Chart1.SeriesCollection.Add(getRandomData())
End Sub
Function getRandomData() As SeriesCollection
Dim SC As SeriesCollection = New SeriesCollection()
Dim myR As Random = New Random(3)
For a As Integer = 1 To 4
Dim s As Series = New Series()
s.Name = "Series " & a.ToString()
For b As Integer = 1 To 9
Dim e As Element = New Element()
e.YValue = myR.Next(50)
e.XValue = (360/10)*b
s.Elements.Add(e)
Next b
SC.Add(s)
Next a
Return SC
End Function
</script>
</head>
<body>
<div style="text-align:center">
<dotnet:Chart id="Chart" runat="server" Width="568px" Height="344px">
</dotnet:Chart>
<dotnet:Chart id="Chart1" runat="server" Width="568px" Height="344px">
</dotnet:Chart>
</div>
</body>
</html>
- Sample FilenameRadarMarkersInFront.aspx
- VersionLegacy (Pre 3.0)
- Uses DatabaseNo