Gallery
Org Headers Ribbon Caps
<%@ Page Language="C#" Description="dotnetCHARTING Component" %>
<%@ Register TagPrefix="dotnet" Namespace="dotnetCHARTING" Assembly="dotnetCHARTING" %>
<%@ Import Namespace="System.Drawing" %>
<%@ Import Namespace="System.Drawing.Drawing2D" %>
<%@ Import Namespace="dotnetCHARTING.Mapping" %>
<script runat="server">
void Page_Load(Object sender, EventArgs e)
{
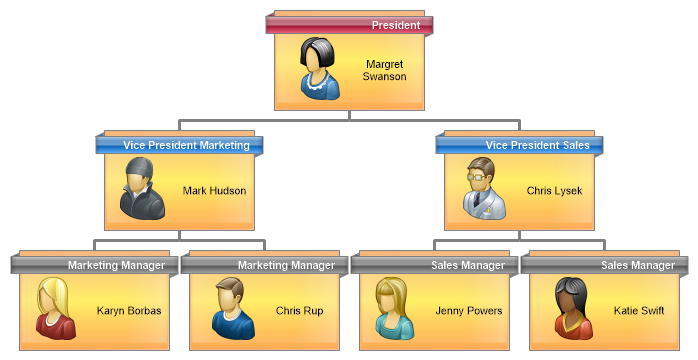
// Demonstrates an organizational chart using annotations with headers.
Chart.TempDirectory = "temp";
Chart.Debug = true;
Chart.Type = ChartType.Organizational;
Chart.Size = "750x430";
Chart.ChartArea.Padding = 20;
Chart.DefaultElement.Annotation = new Annotation("<img:../../../images/Org%image.png>%Name");
Chart.DefaultElement.Annotation.Header.Label.Text = "%position";
Chart.DefaultElement.Annotation.Header.Label.Font = new Font("Arial", 8, FontStyle.Bold);
Chart.DefaultElement.Annotation.Padding = 5;
Chart.DefaultElement.Annotation.Size = new Size(150, 100);
Chart.DefaultElement.Annotation.HeaderBackground.Color = Color.FromArgb(108, 108, 108);
Chart.DefaultElement.Annotation.HeaderBackground.ShadingEffectMode = ShadingEffectMode.Two;
Chart.DefaultElement.Annotation.Background.Color = Color.LemonChiffon;// Color.FromArgb(255, 213, 115);
Chart.DefaultElement.Annotation.Background.ShadingEffectMode = ShadingEffectMode.Background1;
Chart.DefaultElement.Annotation.HeaderLabel.Color = Color.White;
Chart.DefaultElement.Annotation.DefaultCorner = BoxCorner.Square;
BoxHeaderOptions head = Chart.DefaultElement.Annotation.Header;
head.Label.Alignment = StringAlignment.Far;
head.StartCap = BoxCapStyle.RibbonUp;
head.EndCap = BoxCapStyle.RibbonDown;
head.StartAlignment = EdgeAlignment.Edge;
head.EndAlignment = EdgeAlignment.Edge;
head.VerticalAlignment = EdgeAlignment.Inside;
head.Orientation = dotnetCHARTING.Orientation.Top;
head.Offset = new Point(0, 6);
Chart.DefaultSeries.Line.Width = 3;
Chart.DefaultSeries.Line.Color = Color.Gray;
// *DYNAMIC DATA NOTE*
// This sample uses random data to populate the chart. To populate
// a chart with database data see the following resources:
// - Use the getLiveData() method using the dataEngine to query a database.
// - Help File > Getting Started > Data Tutorials
// - DataEngine Class in the help file
// - Sample: features/DataEngine.aspx
SeriesCollection mySC = getData();
// Modify colors of some annotation headers
mySC[0][0].Annotation = new Annotation();
mySC[0][0].Annotation.Header.Background.Color = Color.Crimson;
mySC[0][1].Annotation = new Annotation();
mySC[0][1].Annotation.Header.Background.Color = Color.DodgerBlue;
mySC[0][2].Annotation = new Annotation();
mySC[0][2].Annotation.Header.Background.Color = Color.DodgerBlue;
// Add the random data.
Chart.SeriesCollection.Add(mySC);
}
SeriesCollection getData()
{
Element e1 = new Element("Margret Swanson");
Element e2 = new Element("Mark Hudson");
Element e3 = new Element("Chris Lysek");
Element e4 = new Element("Karyn Borbas");
Element e5 = new Element("Chris Rup");
Element e6 = new Element("Jenny Powers");
Element e7 = new Element("Katie Swift");
e1.CustomAttributes.Add("position", "President");
e2.CustomAttributes.Add("position", "Vice President Marketing");
e3.CustomAttributes.Add("position", "Vice President Sales");
e4.CustomAttributes.Add("position", "Marketing Manager");
e5.CustomAttributes.Add("position", "Marketing Manager");
e6.CustomAttributes.Add("position", "Sales Manager");
e7.CustomAttributes.Add("position", "Sales Manager");
e1.CustomAttributes.Add("image", "7");
e2.CustomAttributes.Add("image", "1");
e3.CustomAttributes.Add("image", "2");
e4.CustomAttributes.Add("image", "4");
e5.CustomAttributes.Add("image", "6");
e6.CustomAttributes.Add("image", "8");
e7.CustomAttributes.Add("image", "9");
e2.Parent = e1;
e3.Parent = e1;
e4.Parent = e2;
e5.Parent = e2;
e6.Parent = e3;
e7.Parent = e3;
return new SeriesCollection(new Series("", e1, e2, e3, e4, e5, e6, e7));
}
SeriesCollection getLiveData()
{
DataEngine de = new DataEngine("ConnectionString goes here");
de.ChartObject = Chart; // Necessary to view any errors the dataEngine may throw.
de.SqlStatement = "SELECT XAxisColumn, YAxisColumn FROM ....";
return de.GetSeries();
}
</script>
<html xmlns="http://www.w3.org/1999/xhtml">
<head>
<title>.netCHARTING Sample</title>
</head>
<body>
<div align="center">
<dotnet:Chart ID="Chart" runat="server" />
</div>
</body>
</html>
<%@ Page Language="vb" Description="dotnetCHARTING Component" %>
<%@ Register TagPrefix="dotnet" Namespace="dotnetCHARTING" Assembly="dotnetCHARTING" %>
<%@ Import Namespace="System.Drawing" %>
<%@ Import Namespace="System.Drawing.Drawing2D" %>
<%@ Import Namespace="dotnetCHARTING.Mapping" %>
<script runat="server">
Sub Page_Load(ByVal sender As Object, ByVal e As EventArgs)
' Demonstrates an organizational chart using annotations with headers.
Chart.TempDirectory = "temp"
Chart.Debug = True
Chart.Type = ChartType.Organizational
Chart.Size = "750x430"
Chart.ChartArea.Padding = 20
Chart.DefaultElement.Annotation = New Annotation("<img:../../../images/Org%image.png>%Name")
Chart.DefaultElement.Annotation.Header.Label.Text = "%position"
Chart.DefaultElement.Annotation.Header.Label.Font = New Font("Arial", 8, FontStyle.Bold)
Chart.DefaultElement.Annotation.Padding = 5
Chart.DefaultElement.Annotation.Size = New Size(150, 100)
Chart.DefaultElement.Annotation.HeaderBackground.Color = Color.FromArgb(108, 108, 108)
Chart.DefaultElement.Annotation.HeaderBackground.ShadingEffectMode = ShadingEffectMode.Two
Chart.DefaultElement.Annotation.Background.Color = Color.LemonChiffon ' Color.FromArgb(255, 213, 115);
Chart.DefaultElement.Annotation.Background.ShadingEffectMode = ShadingEffectMode.Background1
Chart.DefaultElement.Annotation.HeaderLabel.Color = Color.White
Chart.DefaultElement.Annotation.DefaultCorner = BoxCorner.Square
Dim head As BoxHeaderOptions = Chart.DefaultElement.Annotation.Header
head.Label.Alignment = StringAlignment.Far
head.StartCap = BoxCapStyle.RibbonUp
head.EndCap = BoxCapStyle.RibbonDown
head.StartAlignment = EdgeAlignment.Edge
head.EndAlignment = EdgeAlignment.Edge
head.VerticalAlignment = EdgeAlignment.Inside
head.Orientation = dotnetCHARTING.Orientation.Top
head.Offset = New Point(0, 6)
Chart.DefaultSeries.Line.Width = 3
Chart.DefaultSeries.Line.Color = Color.Gray
' *DYNAMIC DATA NOTE*
' This sample uses random data to populate the chart. To populate
' a chart with database data see the following resources:
' - Use the getLiveData() method using the dataEngine to query a database.
' - Help File > Getting Started > Data Tutorials
' - DataEngine Class in the help file
' - Sample: features/DataEngine.aspx
Dim mySC As SeriesCollection = getData()
' Modify colors of some annotation headers
mySC(0)(0).Annotation = New Annotation()
mySC(0)(0).Annotation.Header.Background.Color = Color.Crimson
mySC(0)(1).Annotation = New Annotation()
mySC(0)(1).Annotation.Header.Background.Color = Color.DodgerBlue
mySC(0)(2).Annotation = New Annotation()
mySC(0)(2).Annotation.Header.Background.Color = Color.DodgerBlue
' Add the random data.
Chart.SeriesCollection.Add(mySC)
End Sub
Function getData() As SeriesCollection
Dim e1 As Element = New Element("Margret Swanson")
Dim e2 As Element = New Element("Mark Hudson")
Dim e3 As Element = New Element("Chris Lysek")
Dim e4 As Element = New Element("Karyn Borbas")
Dim e5 As Element = New Element("Chris Rup")
Dim e6 As Element = New Element("Jenny Powers")
Dim e7 As Element = New Element("Katie Swift")
e1.CustomAttributes.Add("position", "President")
e2.CustomAttributes.Add("position", "Vice President Marketing")
e3.CustomAttributes.Add("position", "Vice President Sales")
e4.CustomAttributes.Add("position", "Marketing Manager")
e5.CustomAttributes.Add("position", "Marketing Manager")
e6.CustomAttributes.Add("position", "Sales Manager")
e7.CustomAttributes.Add("position", "Sales Manager")
e1.CustomAttributes.Add("image", "7")
e2.CustomAttributes.Add("image", "1")
e3.CustomAttributes.Add("image", "2")
e4.CustomAttributes.Add("image", "4")
e5.CustomAttributes.Add("image", "6")
e6.CustomAttributes.Add("image", "8")
e7.CustomAttributes.Add("image", "9")
e2.Parent = e1
e3.Parent = e1
e4.Parent = e2
e5.Parent = e2
e6.Parent = e3
e7.Parent = e3
Return New SeriesCollection(New Series("", e1, e2, e3, e4, e5, e6, e7))
End Function
Function getLiveData() As SeriesCollection
Dim de As DataEngine = New DataEngine("ConnectionString goes here")
de.ChartObject = Chart ' Necessary to view any errors the dataEngine may throw.
de.SqlStatement = "SELECT XAxisColumn, YAxisColumn FROM ...."
Return de.GetSeries()
End Function
</script>
<html xmlns="http://www.w3.org/1999/xhtml">
<head>
<title>.netCHARTING Sample</title>
</head>
<body>
<div align="center">
<dotnet:Chart ID="Chart" runat="server" />
</div>
</body>
</html>
- Sample FilenameGallery/M14.aspx
- Version6.2
- Uses DatabaseNo